CALCULATION MODULE – PRESENTATION OF SAVINGS AND PROJECTIONS FOR CLIENTS
Supporting the sales process by showing the client real savings – both now and in the future.
Application in the form of a calculator:
- compares currency exchange costs on the platform with bank offers,
- takes into account individual transfer costs,
- simulates savings over a given period and in a longer time horizon.
As part of the currency exchange platform system, a sales module in the form of a calculator was created, the main goal of which was to show the client the real savings resulting from using the currency exchange platform.
The solution increased conversion in the sales process by showing the client not only the current benefit but also the future savings potential – in a specific and numerical way.
Tool:
- used Forex exchange rate data,
- automatically accounted for actual transfer costs for each bank,
- presented the client with a detailed savings analysis compared to bank solutions,
- generated projections of potential savings from continued platform use,
- supported advisors in the sales process with data and simulations that were clear and convincing.
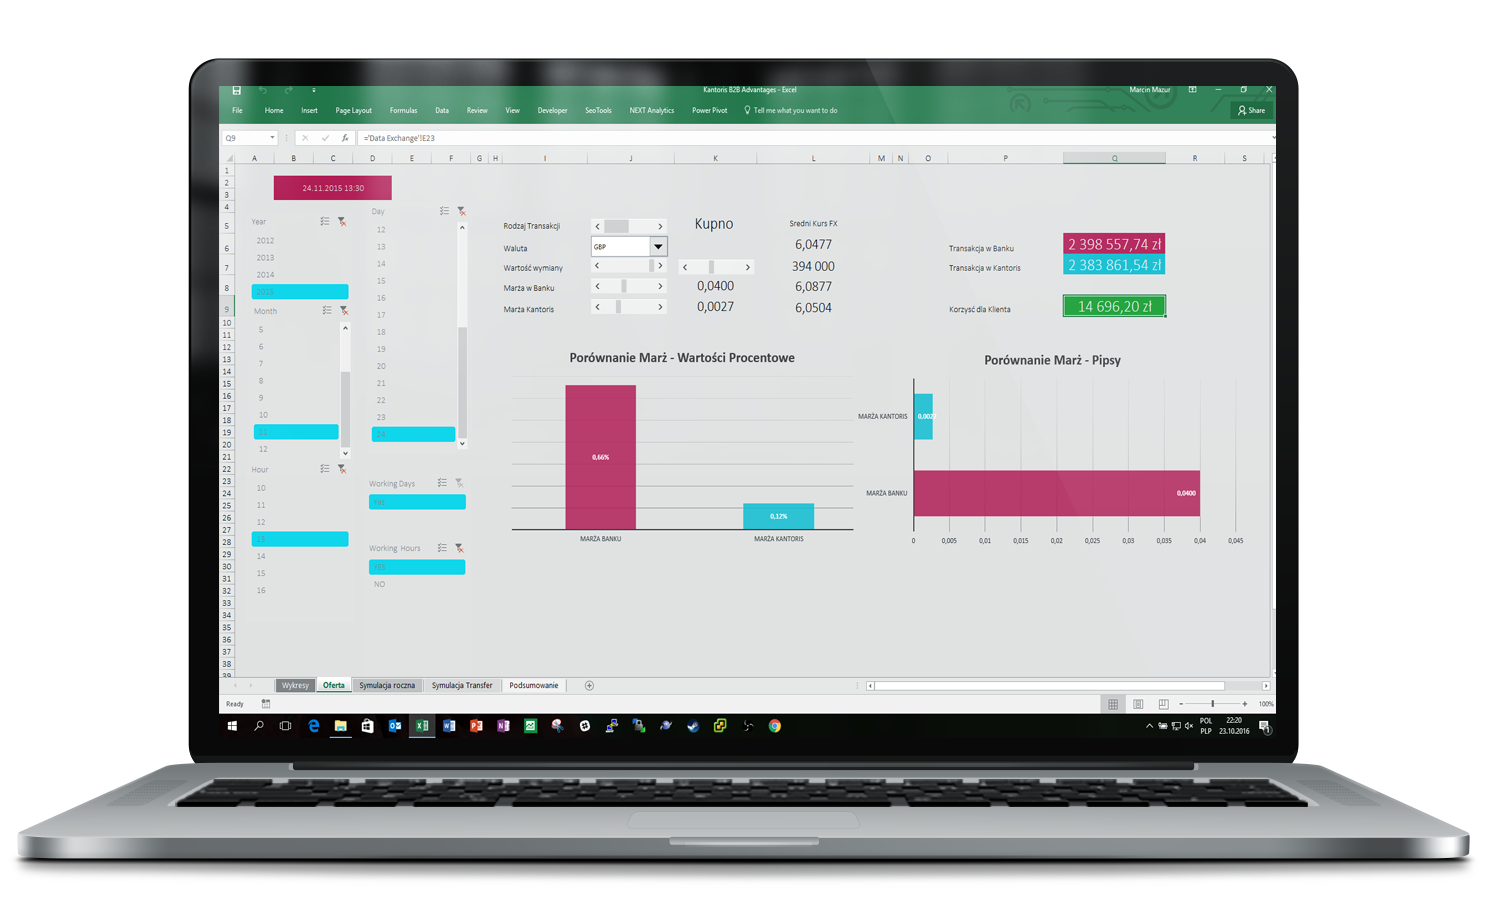
MARGIN AND SAVINGS ANALYSIS
The designed interface allowed the salesperson to:
- enter all transaction parameters (currency, time, amount, bank),
- instantly obtain a cost comparison,
- show the client the margin difference – in percent, pips, and monetary values.
Thanks to this, the application became a tool for convincing through numbers – not just declarations.
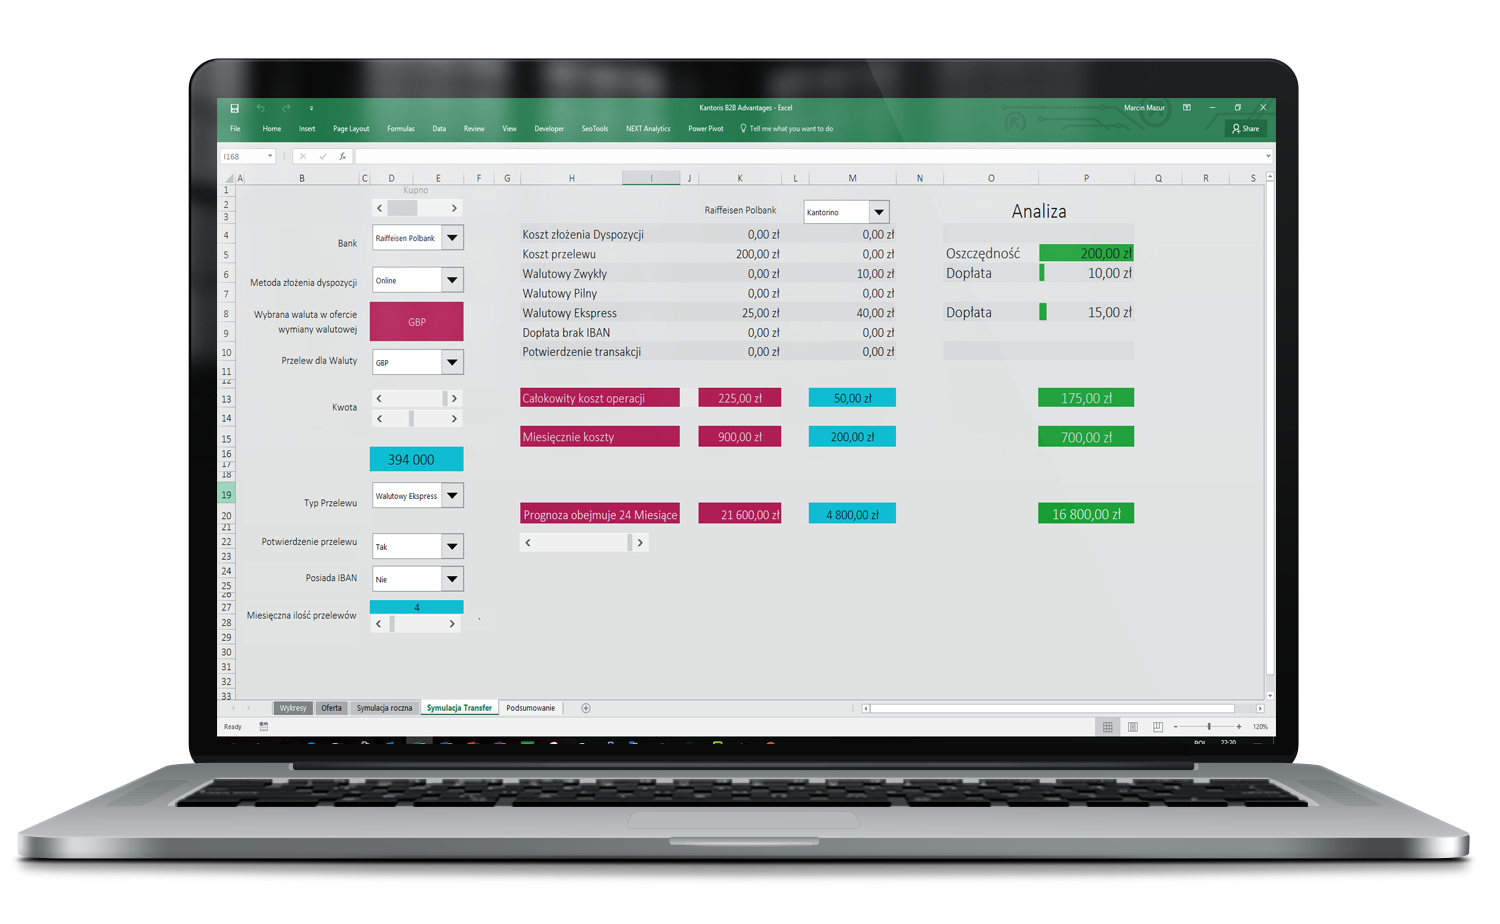
The system took into account:
- the bank, type of transfer, order method, IBAN presence,
- current bank rates and promotional own rates,
- a full cost simulation for a month and two-year period.
The solution allowed the client to immediately see the opportunity cost – and possible benefit.
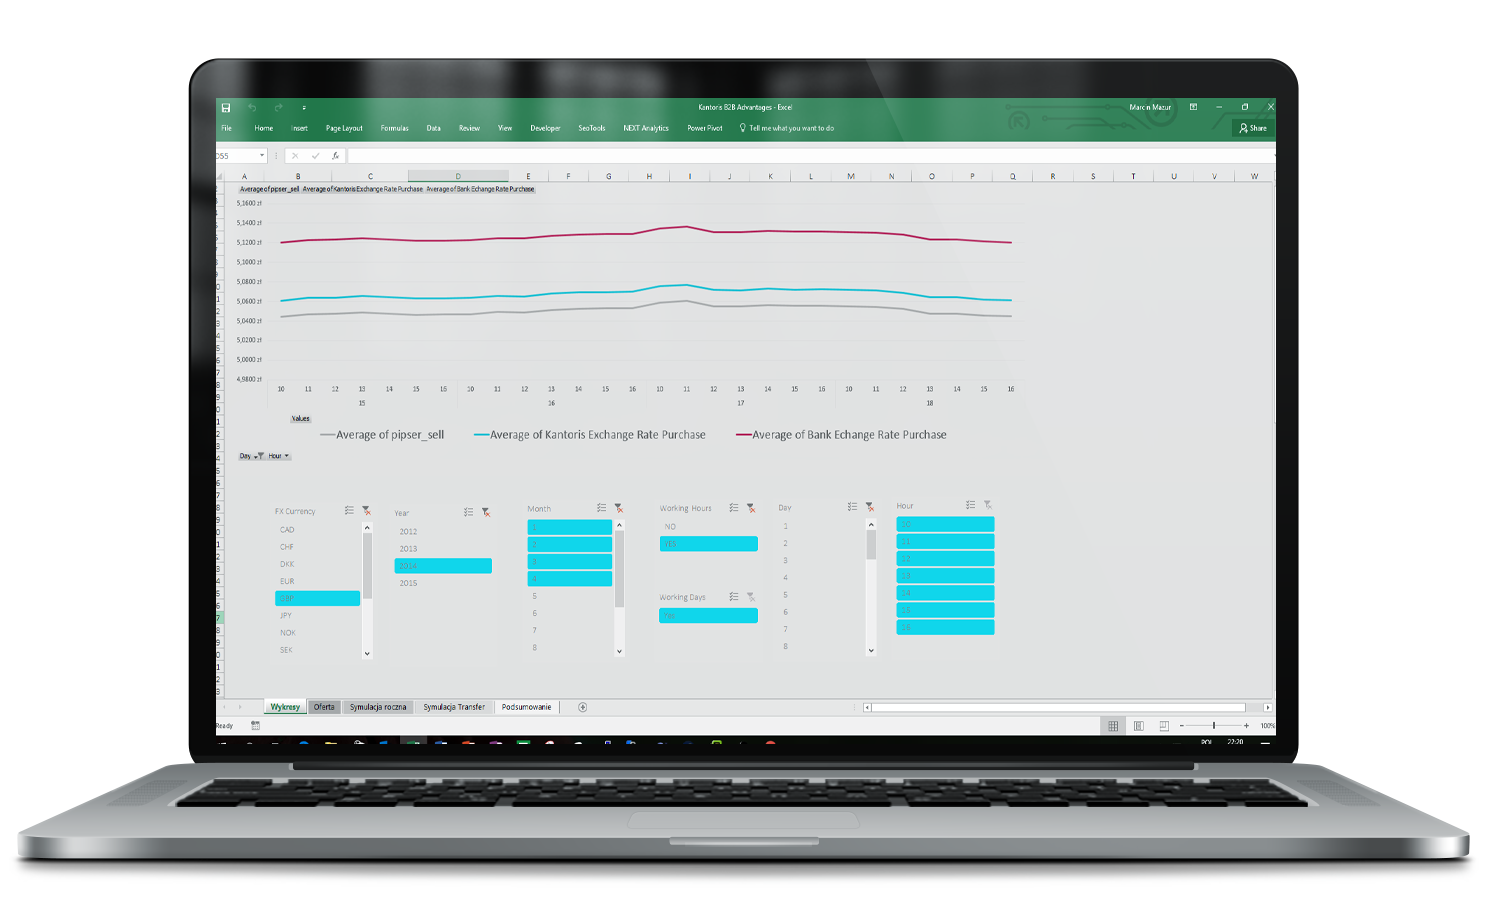
EXCHANGE RATE COMPARISON – HISTORICAL AND CURRENT DATA
One of the key elements of the application was a module that allowed for:
- automatically retrieving the historical Forex rate for a given day and hour,
- comparing it with the bank rate and the rate offered on the platform,
- calculating the actual cost difference for each transaction – also retrospectively.
The application combined current market conditions with historical data analysis – creating a complete picture of potential savings.
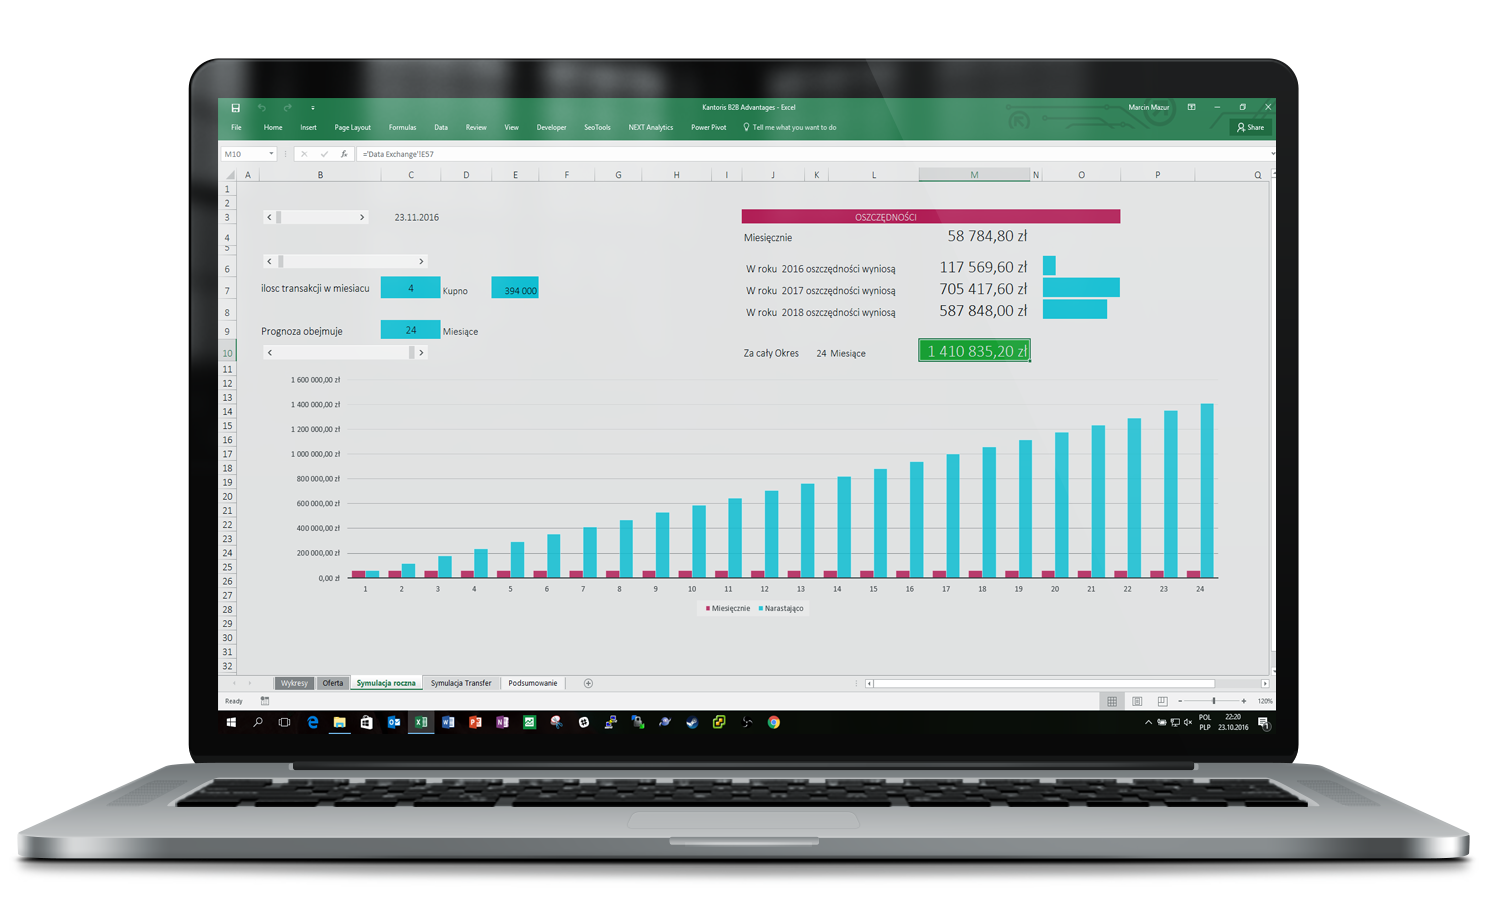
DYNAMIC SAVINGS PROJECTIONS
Convincing simulation based on your operational data
- number of transactions per month,
- value and frequency of operations,
- cost differences between systems or financial service providers.
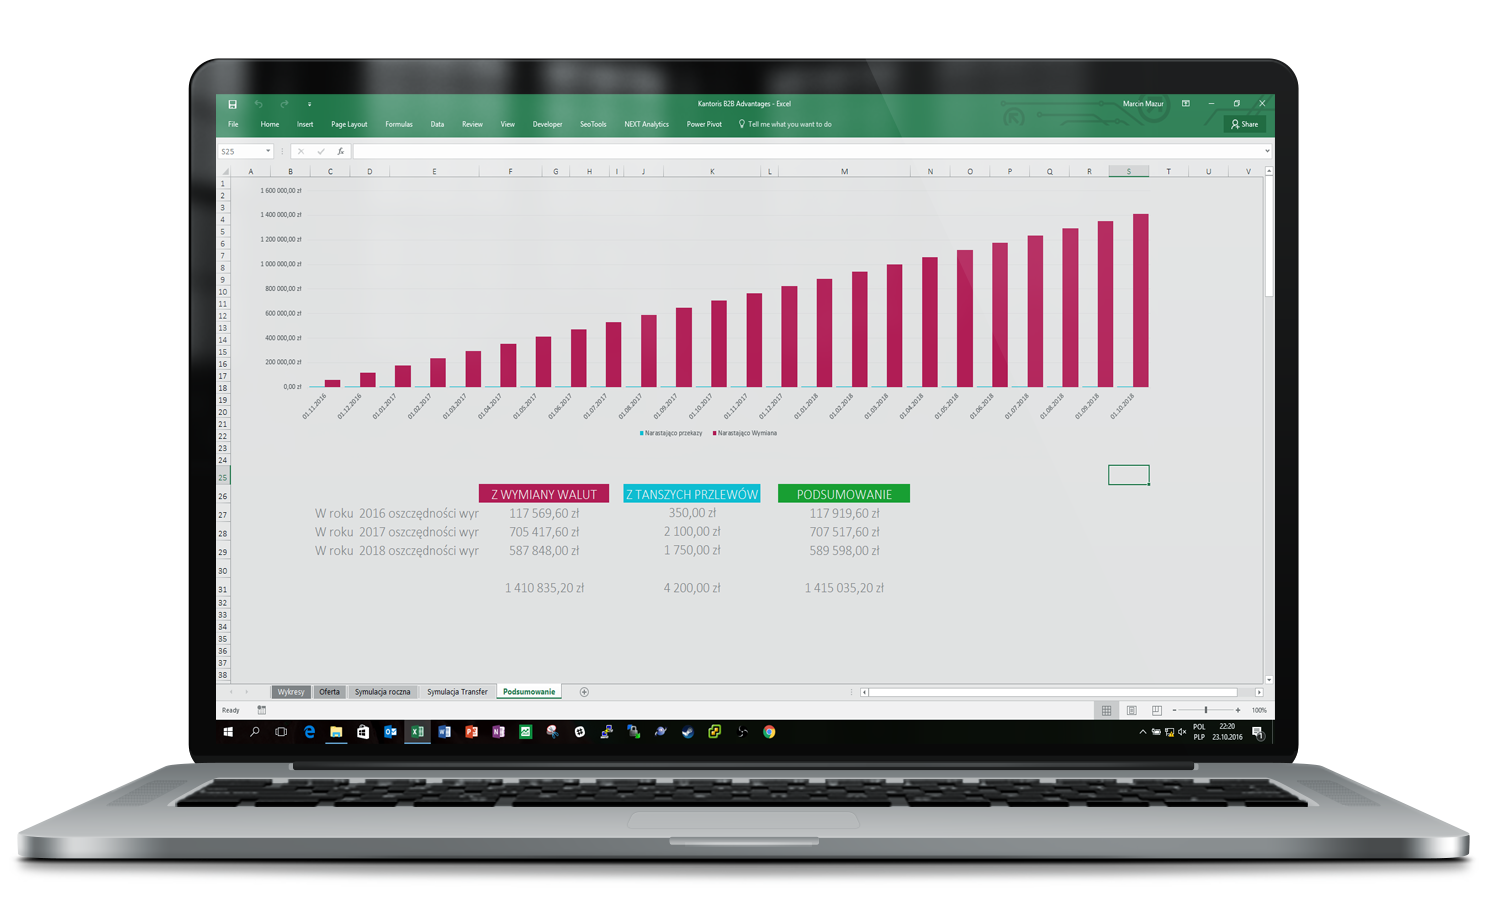
The forecasting function calculates savings over months and presents them as a growing bar chart.
Presenting cumulative data over time creates an instant “WOW” effect – it works perfectly during board meetings, discussions with business partners, or as part of a professional offer.
All in one file, with no need to run additional systems – Excel is enough.