


Numbers that convince the investor. A financial model that withstands every question.
Every number has its source, every scenario makes business sense, and every change in assumptions is immediately visible in the result.
Investors and banks do not evaluate slides alone — they evaluate the logic behind the numbers. A financial model should reflect the real way the company operates: its sales, costs, resources, working capital and cash flows. Origami Effect combines Finance Management and transactional experience (VC/PE, M&A) with data engineering to create financial-operational models based on real data and business logic.
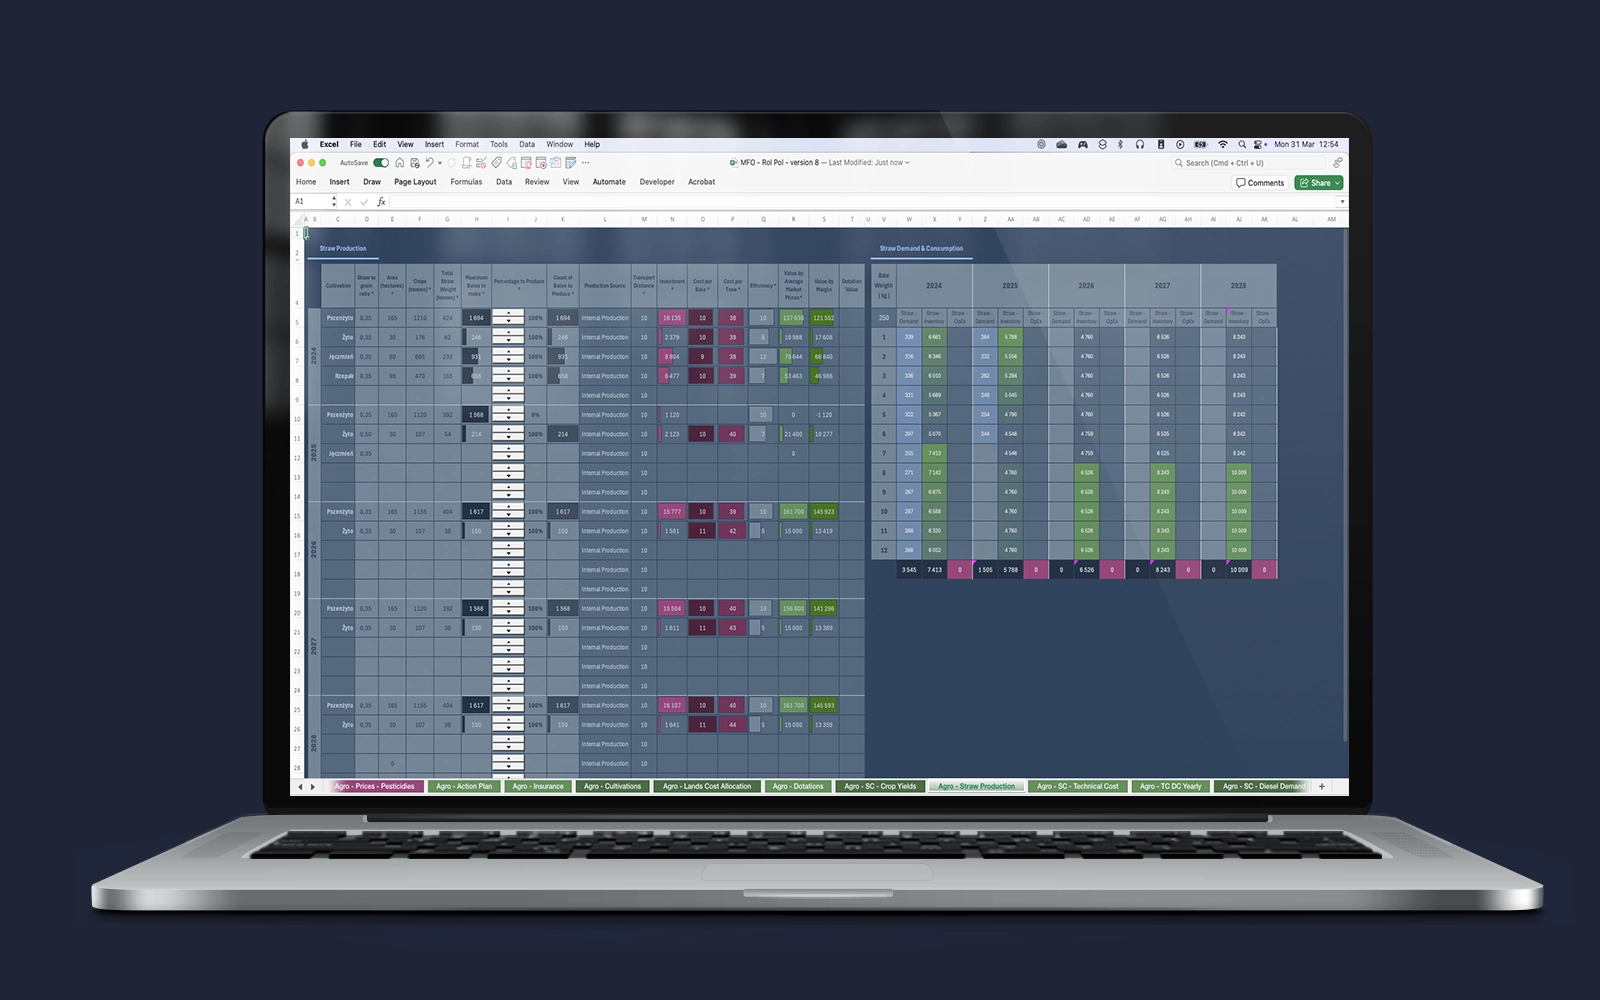
What do investors and banks really expect?
Transparency
- clear data origin and unambiguous assumptions
- consistent logic between sales, costs, balance sheet and Cash Flow
- a model that can be easily and confidently defended in the Due Diligence process
Model resilience
- dynamic scenarios: base, pessimistic and optimistic
- sensitivity analysis for key parameters (What-If)
- verification of liquidity, working capital and debt service ratios (DSCR)
Decision-making power
- instant simulations of the effects of investment decisions and CapEx
- the ability to continuously update the model without rebuilding it from scratch
- precise financial conclusions for the Board and Shareholders
Modelling methodology at Origami Effect
Activity-Based Modeling
The model is built on the company’s real processes: sales, production, logistics and resources. This eliminates errors resulting from generic industry benchmarks.
Bottom-Up approach
Construction from the very foundations: volumes, unit prices, costs (full costing), human resources and assets. As a result, every line item in the model is fully auditable.
Digital twin of the enterprise
Mapping of the company’s key dependencies (sales, costs, resources, working capital). It allows simulation of business decisions and assessment of their impact on results, liquidity and company valuation.
Decision interface: Iris and AI
The financial-operational model is a digital representation of the enterprise’s key dependencies. The interactive Dashboard in the Iris environment allows you to observe results, margins, cash flows (Cash Flow) and variances, and to analyse the impact of changes in individual assumptions on the business.
An integrated AI module automatically transforms data into an accessible narrative form, making it easier to understand the conclusions. From the Dashboard you can also generate and download ready-made statements in PDF, Excel and CSV formats at any time, tailored to the requirements of the Bank or Investor.
Transactional and operational experience
Origami Effect designs financial-operational systems that support investment decisions and enterprise management. It combines experience gained while scaling organisations up to PLN 2.4 billion in revenue with transactional experience, finance management and data engineering, delivering the perspective of the Owner, the Board and the Investor.
Technologies & Methodology
Let’s start a conversation about your financial model
Briefly describe the project context and Origami Effect will propose a model structure and work plan tailored to the business objective.
Frequently Asked Questions (FAQ)
What is the difference between a business plan and a financial model?
A business plan describes strategy and the market in narrative form, while a financial model converts those assumptions into valuation and cash flows. In fundraising processes the model is a key decision-making tool for the Bank and the Investor. Methodological differences are explained in detail in the article: Budget, financial model and activity-based model – what is the difference?
What is a digital twin of the enterprise in financial modelling?
It is an advanced, dynamic representation of the company’s business processes and financial-operational dependencies. Unlike static spreadsheets, a digital twin allows real-time testing of scenarios (What-If), simulation of the effects of investment decisions and assessment of their impact on financial results, liquidity and enterprise value. Machine Learning algorithms and Python can additionally support forecasting and anomaly detection.
How is data integration handled when input data comes from multiple systems (ERP, CRM, Excel)?
Modelling includes building a dedicated data unification layer. Raw data from ERP systems, CRM, transactional databases and scattered files are combined into a single coherent ecosystem (Single Source of Truth). This enables automated feeding of the model without risky interventions in the company’s existing IT software.
In what form is the model delivered and how does work with the data look?
The client receives a fully auditable model and access to an interactive Dashboard in the Iris environment. Results are powered by the financial-operational model running in the background (optionally supported by Machine Learning algorithms). An integrated AI module facilitates analysis of conclusions, and from the Dashboard ready-made reports in PDF, Excel or CSV formats can be generated at any time.
When is a DCF valuation necessary?
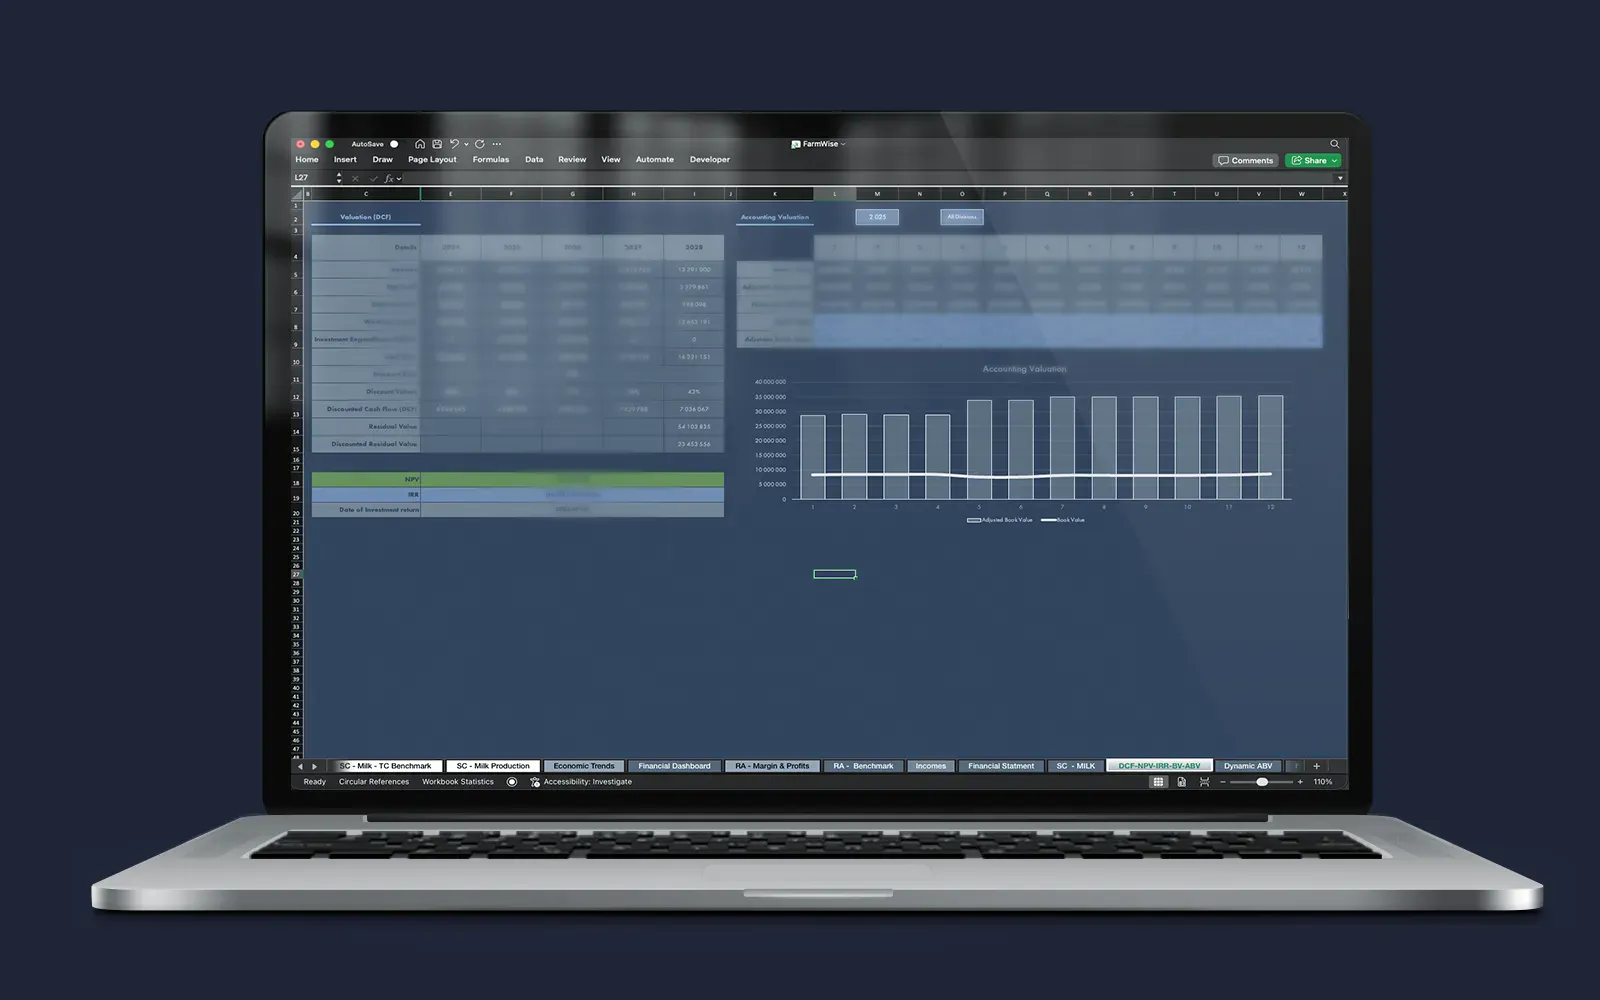
DCF (Discounted Cash Flow) valuation is the market standard in M&A transactions, raising capital from VC/PE funds, assessing the profitability of CapEx projects, and in processes of company division or sale.
Does the financial model also support day-to-day company management?
Yes. A properly designed financial-operational model serves as a tool for continuous controlling, budgeting, variance analysis and ongoing liquidity forecasting.
How is the confidentiality of transactional and financial data protected during the work?
Data security is a priority. All analytical work is carried out under a rigorous non-disclosure agreement. You can verify the provisions and information protection rules by visiting the page: NDA template – non-disclosure agreement. The architecture for storing and processing data meets the highest standards required by banking institutions and funds in Data Room processes.