


Metis — Advanced Financial Model for B2B Import and E-Commerce
Metis is an advanced Digital Twin of the financial-operational structure, dedicated to complex import enterprises with multi-channel sales in the B2B and E-Commerce model. It calculates and allocates every cost element related to the flow of goods and the maintenance of warehouse infrastructure: from a single purchase invoice in a foreign currency, through customs, transport and insurance, all the way to team salaries, fleet leasing and the servicing of investment debt assigned to a specific location. The system does not operate on averaged general costs — every cost item has its own allocation key, its own data source and its own place in the warehouse structure, which makes it possible to calculate the unit cost of inventory (WAC) and the full cost of warehouse maintenance with a precision impossible to achieve with manual, averaged budgeting.
The computational layer of the Metis system is built in Excel as a network of interlinked formulas operating on shared keys — warehouse identifier, product identifier, settlement period date. The formulas do not calculate in isolation: the inventory cost in a given month depends on the cost from the previous month (recursive calculation), and the warehouse cost depends on the structure of the team assigned to its division and on allocation keys defined centrally for the entire warehouse network. A change in a single source value — an exchange rate, an allocation percentage, the composition of a team — propagates through all linked modules. The module descriptions below should be read as elements of a single system of communicating vessels, not as independent functions.
Metis plays three parallel roles in the organisation. First, it is a tool for due diligence and financial analysis — it uses a proprietary predictive engine, originally built for the needs of Quantis, to assess the quality of inventory and the client portfolio independently of current reporting, so as to give an investor or the management board a full, reliable picture of the company’s condition before a decision. Second, it is an operational tool — it collects information on liabilities and receivables that are already known and certain, before the invoice documenting them even appears, supporting current cash-flow management instead of delaying it by the invoicing cycle. Third, it is a source of data and rules for AI agents — it supplies them with goals, constraints, budgets and priorities needed for independent decision-making, including in the module responsible for recommendations of inventory-replenishment orders.
The architecture of the Metis system is based on the same principle as the other systems in the family — each component does what it is best at. Excel provides crystalline calculation quality together with full model control and formula transparency. Calculation results are written to a NoSQL database, from which they are further distributed in the company as budgets, scenarios and data for comparative analyses. Python handles the logic of integration and processing of source data. React builds the dashboards. Language models support the interpretation of already calculated, certain numerical data — the LLM does not calculate, it only gives the numbers from Metis a narrative.
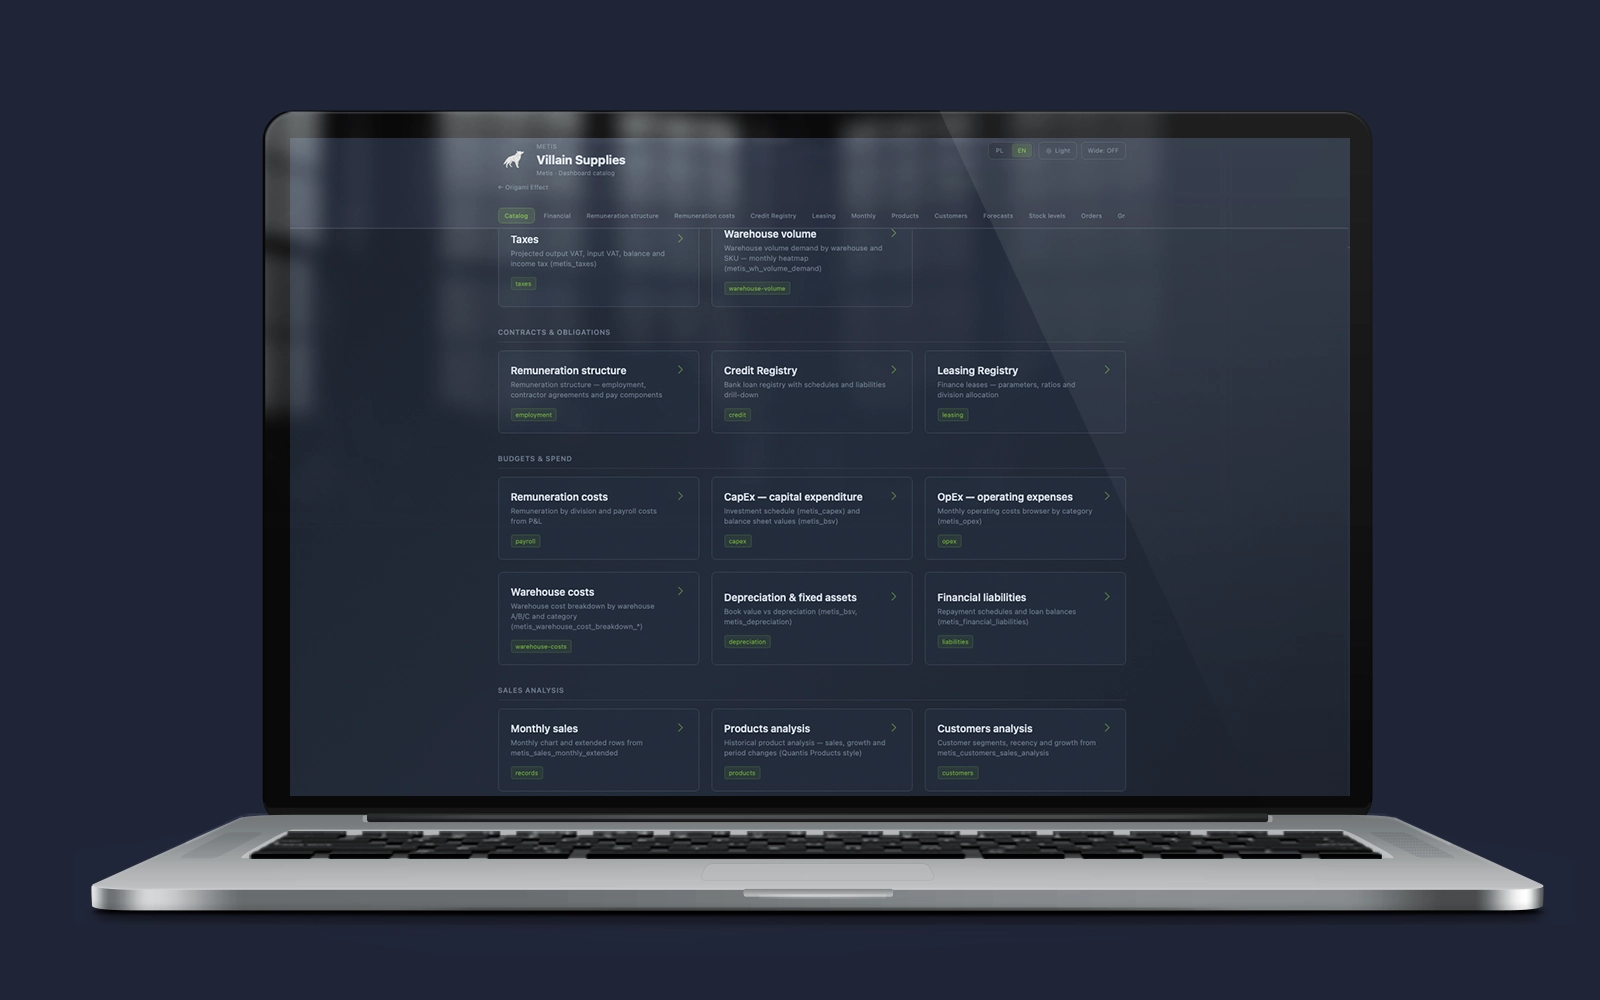
DUE DILIGENCE — inventory and client analysis based on machine learning
Metis is not limited to current cost and margin reporting. It uses the same predictive engine that powers FORECAST: Adaptive Demand Engine — originally built within the Quantis system — for tasks of a different type: assessing inventory quality and the reliability of the B2B client portfolio independently of a single settlement period. This enables Metis to serve as a due-diligence tool — delivering to an investor, the management board or an external auditor a picture of the company verified by data, not by declaration.
DD: Stock Health Scoring
It assesses the quality of the company’s inventory across the entire SKU catalogue, not merely the warehouse stock level. The model uses the same sales-pattern classification layer as FORECAST: Pattern Classification, but instead of selecting a forecasting method it evaluates the risk associated with a given SKU: rotation speed relative to history, the probability of moving into a slow-moving or obsolete state, and the concentration of inventory value in items with elevated risk. The result is not a single number for the whole warehouse, but a risk distribution across SKUs — making it possible to distinguish inventory that looks good only because no one has yet looked at it closely from inventory that is genuinely healthy.
Benefits:
- An investor or company buyer sees the real quality of the inventory, not only its book value — which directly affects valuation.
- Management knows in advance which product categories are beginning to “age”, before this is reflected in cash flow.
- The same predictive engine as in sales forecasting — no need to maintain a separate ML model solely for inventory risk assessment.
DD: Client Risk & Concentration Analysis
It analyses the B2B client portfolio in terms of concentration risk and payment reliability. The model takes into account the history of payment punctuality, the share of a single client in total revenue, and the variability of order volumes over time, building for each client a risk profile analogous to the one that DD: Stock Health Scoring builds for SKUs. The result shows not only which clients generate the largest revenue, but also how many of them the company can realistically lose without a noticeable impact on results — and on whom it is dangerously dependent.
Benefits:
- Revenue concentration risk in a handful of clients is visible directly, before it becomes a problem when one of them leaves.
- Assessment of the reliability of the client portfolio based on hard payment data, not on a salesperson’s subjective opinion.
- Key information in capital transactions — the company buyer sees the quality of the revenue, not only its amount.
AGENTS — Metis as a source of data, rules and directives for Quantis agents
Metis does not generate recommendations directly. It supplies Quantis agents with the data, goals, constraints, budgets and priorities needed to make decisions. The Replenishment Recommendation Agent operating within Quantis analyses this information and generates proposals for inventory-replenishment orders. Quantis is the same engine that, in the forecasting layer, powers FORECAST: Adaptive Demand Engine.
Metis as a Digital Twin: the right purchase at the right moment
Metis acts as a Digital Twin of the entire organisation. As the central management system it has a constant view of the full operational and financial structure of the company: it knows not only the current inventory level or cash flow, but also future plans, budgets and the projected financial condition (CapEx, liabilities, margin targets).
Thanks to this, inventory management is not only about answering the question “what to buy?”, but above all “WHEN exactly to buy it?”.
How does Metis build the background for the AI Agent?
Metis processes and delivers to the Agent the full, dynamic cost of delivery (Landed Cost) and the cost of sale, taking into account real-time market variables:
- Recalculation of present and future costs: Metis estimates costs not at the moment the order is placed, but at the moment the goods actually enter the warehouse and are issued to the customer. The algorithm takes into account:
- Logistics and freight: Variable transport rates (sea, rail, road), fuel surcharges and the risk of delays in the supply chain.
- Customs, taxes and clearance: Current customs tariffs, port fees and agency handling costs.
- Warehousing and space: Cost of occupied space (volume/pallets), picking fees and the opportunity cost of blocking warehouse space.
- Selling expenses: Payment-gateway commissions, marketplace commissions, B2B transaction insurance and the assumed cost of handling returns for a given category.
- Impact of market and macroeconomic factors:
- Exchange-rate fluctuations: Conversion of currency risk when purchasing in foreign currency (USD/EUR/CNY) and selling in PLN.
- Cost of capital and financing: Indicator of the cost of frozen cash (interest, interest rate) — Metis calculates how much it really costs for a given SKU to sit on the shelf.
- Demand dynamics and seasonality: Market fluctuations, competitor actions and industry trends affecting rotation speed.
Why does the Agent need such deep data from the Digital Twin?
The AI Agent does not make decisions in a vacuum. Receiving from Metis a full financial and operational picture of the company, it calculates profitability over time and applies hard financial filters:
- Optimal order timing (Timing): The digital twin knows when the company will have a so-called “liquidity trough” or larger CapEx expenditures. The Agent will not propose an order today if the forecast shows that the ideal moment for the expenditure without breaching safe cash flow will come in 10 days.
- Zero decisions above budget: The Agent will not recommend an order at all for which the company does not have real cover in the budget in the given time window.
- Automatic prioritisation: With limited cash and competing needs for 6,000 SKUs, the Agent knows which order to fulfil immediately in order to build company value, and which can wait.
Effect for the logistician and the analyst
The operational team ceases to be a “calculator” spending days in Excel. It receives from the Agent a ready, financially safe and perfectly timed order recommendation — solely for checking and acceptance.
It moves into a managerial role:
- Watches current KPIs: Focuses on strategic indicators (rotation, total margin, availability).
- Manages by exception: Approves ready recommendations with a single click and reacts only to exceptional situations (market anomalies, freight-rate spikes or supplier delays).
AGENTS: Replenishment Recommendation Agent
It generates proposals for inventory-replenishment orders on the basis of operational and financial data supplied by Metis, which play a dual role for the agent — they are simultaneously goals it pursues and constraints it must not exceed. Because Metis dynamically calculates contribution margin and has precisely identified warehousing, ordering and other cost components, the agent formulates proposals matched to the real profitability of a given SKU, not merely to the stock level. Recommendations also take into account the company’s financial plans — Metis makes the planned cash flow and CapEx available to the agent, so an order proposal is not created in isolation from whether the company actually has financial room for it in the given period. In addition, Metis defines hard constraints in the form of budgets assigned to stock and priorities that order the sequence in which the agent should treat competing order needs.
Benefits:
- Order recommendations take product profitability into account, not only the stock level itself — priority naturally goes to orders that actually pay off.
- The Agent will not recommend an order for which the company has no financial cover — planned cash flow and CapEx act as a hard filter, not merely a background suggestion.
- Budgets and priorities defined centrally in Metis allow the agent to resolve conflicts between competing order needs in a manner consistent with company policy, rather than ad hoc, case by case.
- The data on which the agent works are the same numbers visible in Metis source modules — a recommendation can at any moment be traced back to a specific cost item or forecast that justifies it.
The Replenishment Recommendation Agent is the first, but not the only, agent fed with data from Metis. The same layer of rules, budgets and priorities is prepared to serve further operational agents — e.g. an agent assessing supplier terms against price and freight history, or an agent reporting cost anomalies (a sudden jump in a transport rate, an unusual deviation from budget) before they become visible in the standard monthly report.
INTEGRATIONS — Metis as a plan source for external systems
INTEGRATIONS: Echo Operational Cash Flow Source
Metis serves as a source of plan and data for Echo — the component responsible for managing operational cash flow. Echo supplements the company’s liquidity picture with information that is not yet physically present on invoices: payments that are known and certain before the invoice documenting them even appears. Metis supplies Echo with the plan and the source data needed for this supplementation, so that operational cash-flow management is based not only on what has already been invoiced, but also on what is planned and certain yet still unposted.
Benefits:
- The company’s liquidity picture is not delayed by the invoicing cycle — known, certain payments are visible in cash flow before the invoice even arrives.
- Operational liquidity planning is based on the same coherent planning data as the rest of the financial model, not on a separate, manually maintained payment-forecast spreadsheet.
CASHFLOW: Pre-Invoice Commitment Tracker
It collects liabilities and receivables that are already known and certain before the invoice documenting them is created — information that no accounting system can yet physically see. The source of these data are operational modules scattered throughout Metis: confirmed purchase orders from STOCK: Purchase Order Costing, planned salaries and contributions from WAREHOUSE: Wages & Payroll Contributions Allocation, lease instalments and interest from EFAR: CapEx Cash Data, and contracted campaign expenditures from TRAFFIC. The module does not calculate a new value — it organises existing liabilities and receivables into a single coherent timeline and passes it on to Echo as a ready operational cash-flow plan.
Benefits:
- The company’s liquidity picture is built from what has actually already been agreed (order, contract, schedule), not from an estimate or an average.
- The finance team does not have to manually gather liabilities scattered across different departments before every liquidity-forecast update.
- A single place where all of the company’s future liabilities are visible — regardless of which Metis module they originated in.
STOCK — valuation of warehouse inventory
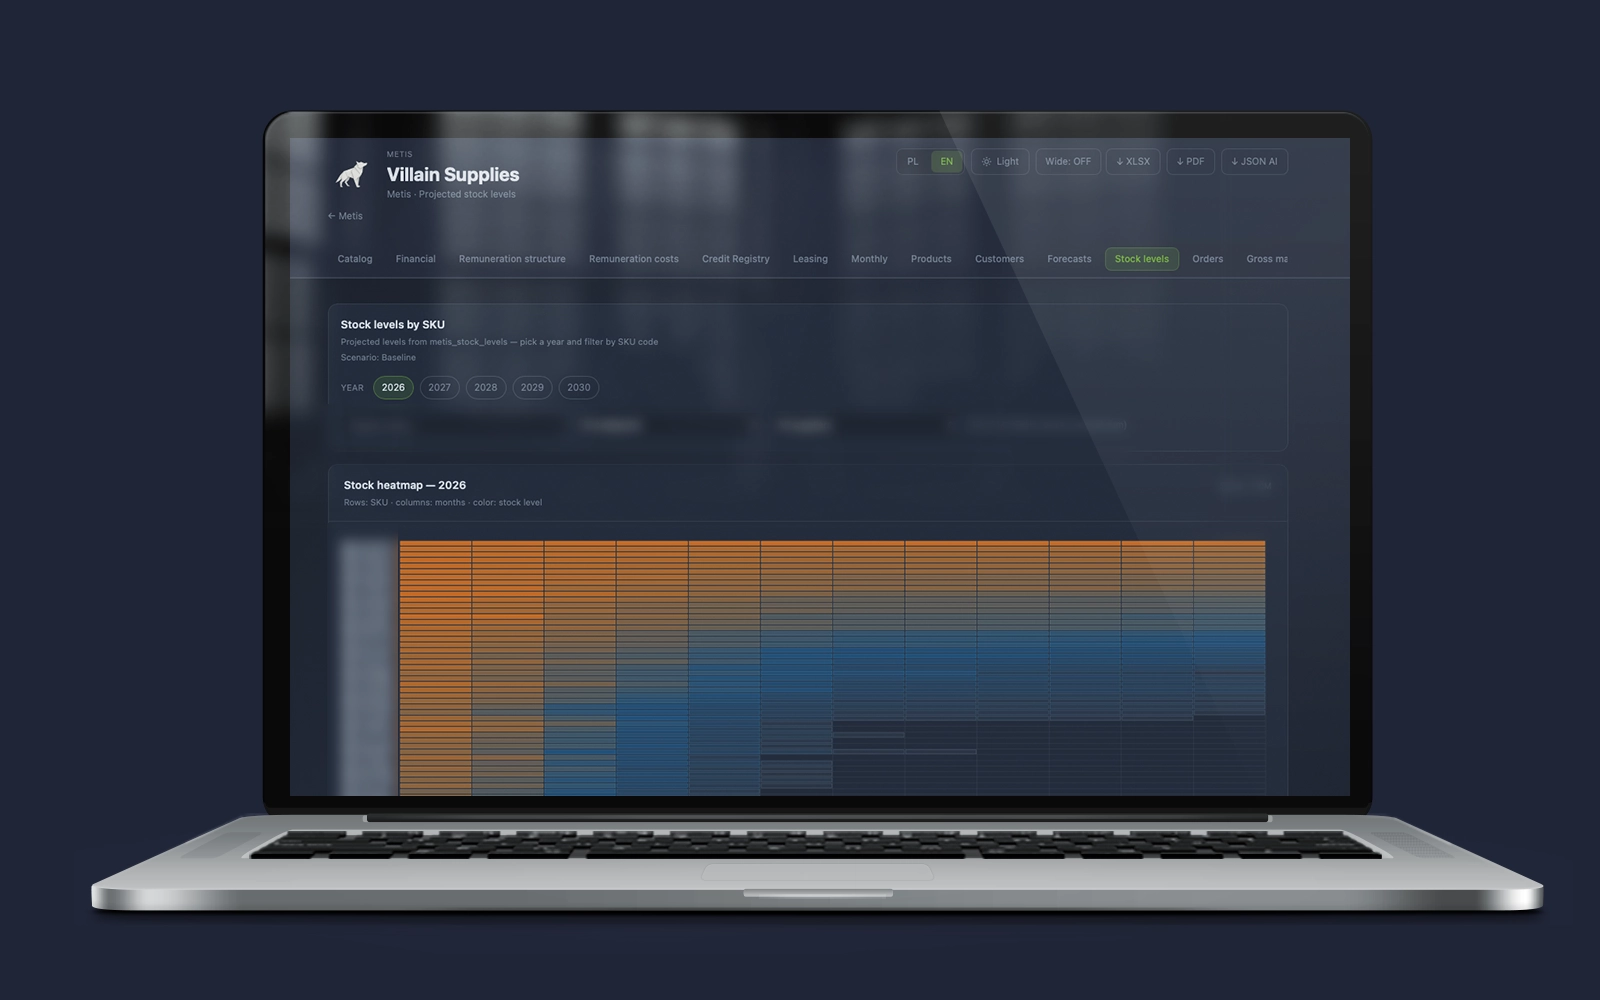
STOCK: Purchase Order Costing
It converts every purchase order into a value in PLN, treating the advance payment and the final payment as separate payment events with separate exchange rates. For each payment the module first checks whether a real (bank) rate has been provided — if so, it uses it instead of the tabular rate; if not, it reaches for the rate table according to the month of the given payment. The same logic is applied separately to the transport cost, with the rate selected according to the date of the transport payment, not the date of the goods purchase. The module feeds STOCK: Weighted Average Cost Engine with the purchase value and quantity assigned to the given product and period.
Benefits:
- An end to a single averaged rate for the entire invoice — every payment is settled at the real rate of the day it was executed.
- The finance team does not have to manually watch which rate to apply to the advance, the final payment or transport.
- Purchases in EUR, USD, GBP and CNY are calculated by the same coherent mechanism — without exceptions and manual adjustments.
STOCK: Currency Requirement & Hedging
Metis manages the company’s currency requirement arising from planned orders and payments. It converts the value of every order in foreign currency, shows future demand for EUR, USD, GBP and CNY, and allows comparison of the impact of different rates on purchase cost, landed cost and contribution margin.
The module also makes it possible to assess a decision to hedge the rate. After indicating a hedged rate, Metis immediately recalculates the order cost and shows how hedging or leaving the position open changes the margin of the product, the warehouse and the entire planned transaction. Management therefore sees not only currency exposure, but also the financial consequence of a concrete decision.
The module’s logic is based on Origami Effect’s experience in modelling and analysing currency flows for companies whose total currency-exchange value amounted to PLN 2.5 billion. Practical experience covers both financial models and a Business Intelligence system for an online currency-exchange platform.
Benefits:
- Future currency requirement results directly from planned orders and payment dates.
- A single rate change immediately shows the impact on purchase cost, landed cost and margin.
- It is possible to compare the current rate, a scenario rate and a hedged rate before taking a decision.
- Rate hedging is assessed through its impact on the profitability of a specific SKU, order and warehouse, not as a detached financial operation.
STOCK: Customs & NBP Rate
It calculates customs duty into the inventory cost base. The customs base — the sum of the goods value, transport and insurance — is converted at a separate, official NBP rate, in accordance with customs settlement practice, independently of the transactional rate used to book the invoice. The percentage duty rate is selected from a central rate table on the basis of the tariff identifier assigned to the order and the settlement period. The absence of a defined rate for a given item results in zero duty being charged, not a calculation error. The module’s result enters directly into the purchase value calculated by STOCK: Purchase Order Costing.
Benefits:
- The customs base is calculated in accordance with official practice (NBP rate), so inventory valuation is consistent with how customs duty is actually settled.
- The absence of a defined rate does not break the report with an error — the system quietly assumes 0 and continues.
- Customs duty is not a separate, manually attached cost — it is an integral part of the product unit cost from day one.
STOCK: Weighted Average Cost Engine
The core of inventory valuation — it calculates the unit cost of every product by the moving weighted-average method (WAC), separately for each settlement period. The mechanism works in two stages: first it adds the current period’s purchase to the balance from the previous period and recalculates the new weighted average; only then does it value the sales of the same period at that updated average — which distinguishes it from simpler models that value issues at the pre-delivery price. Inventory sold down to zero or below in a given period does not interrupt the calculation: the module carries forward as the base cost the last updated average. The result of each period becomes the starting point for the next period — hence the calculation is recursive along the time axis.
Benefits:
- Cost of goods sold (COGS) always takes into account the most recent delivery of the same period, not the price from a month earlier — a solid basis for calculating true margin instead of an approximation.
- Selling out the entire stock does not break the report — the system does not divide by zero, but sensibly continues on the last known price.
- A single coherent mechanism for the entire product catalogue, regardless of how frequently a given SKU is bought or sold.
STOCK: New Product Fallback
It handles the case of a product with no warehouse history at all — no balance from the previous period and no purchase in the current period. Instead of a zero valuation, the module reaches into the product master for the catalogue price and converts it to PLN at the appropriate currency rate. This prevents a situation in which a newly introduced product is reported with a zero inventory cost despite a real existing value.
Benefits:
- New products appear in the report with a real valuation from day one, not with a zero that artificially inflates margin.
- Introducing a new SKU into the assortment does not require the finance team to manually “estimate” the cost.
STOCK: Warehouse Cost Allocation by Volume
It allocates the warehouse cost from WAREHOUSE: Cost Matrix Output to an individual product (SKU) proportionally to the volume it occupies. Mechanism: the cost of the entire warehouse is divided by the sum of the volumes of all products assigned to that warehouse, yielding a unit cost per m³, which is then multiplied by the volume of the specific SKU. This closes the Metis cost chain at the lowest level of detail — linking location cost (WAREHOUSE) with the cost of a concrete product (STOCK), and serving as a direct input to contribution margin per SKU.
Benefits:
- Warehousing cost ceases to be a “general” cost added as a flat rate — a product occupying more space bears a proportionally higher warehousing cost.
- Storage cost becomes a separate, measurable component of product cost — ready to be included in contribution margin per SKU, alongside purchase cost.
- Products that are unprofitable in terms of the warehouse space they occupy become visible, even if the pure trading margin on them looks good.
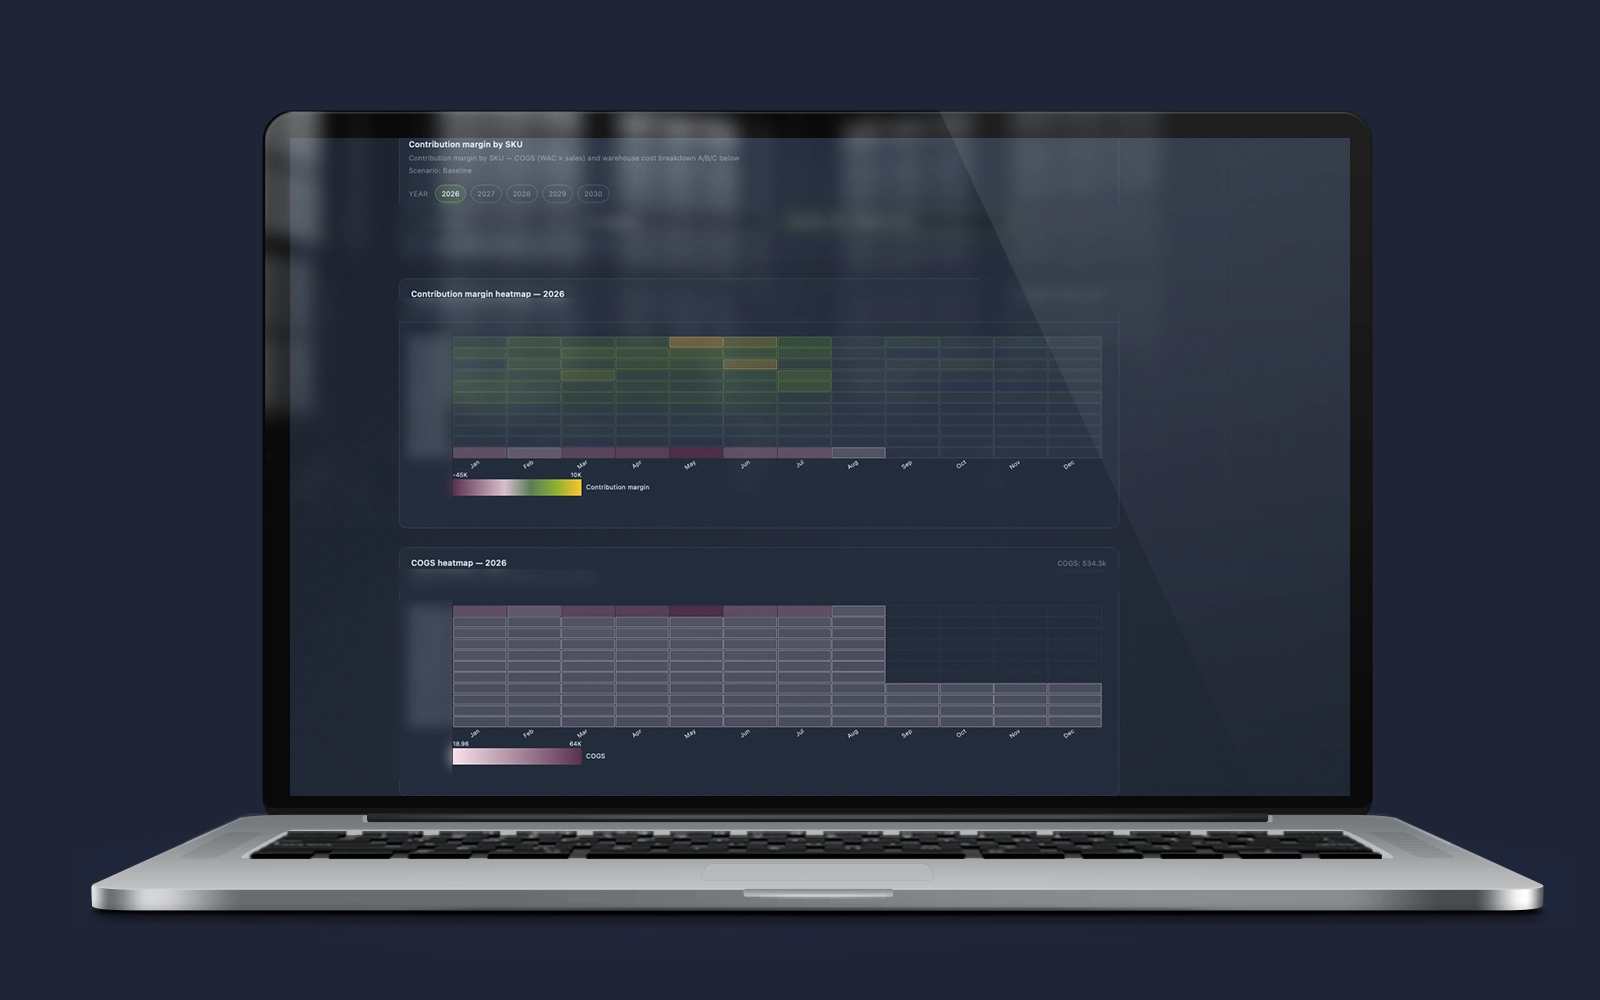
FULFILLMENT — packing and basket profile per SKU
Metis does not stop at the dimensions and weight of a single product from the master data. The master data say how large the SKU itself is — but the real fulfilment cost depends on the package and the company in which the product is actually sold. A light product that usually ends up in a large, multi-item order generates an expensive shipment despite the small size of the individual unit. Without this knowledge the cost model uses a single averaged packing and shipping rate for the entire catalogue — which distorts margin and product ranking. The module builds, per SKU, a historical profile of this phenomenon on the basis of actual orders, treating one transaction (sales document) as one pick & pack package. This is descriptive analytics — aggregation of history and classification against thresholds — not a learning model that forecasts package mix; that role is played separately by FORECAST: Adaptive Demand Engine, which supplies volume, while the fulfilment profile supplies its character.
FULFILLMENT: Size & Weight Classification
It classifies the product and the order separately. The product receives a dimensional class (based on the longest side) and an effective weight class, with optional consideration of dimensional weight where the carrier applies it. The order — i.e. the sum of all items going into one package — receives its own dimension class and its own weight class, and the final fulfilment class takes the worse of the two assessments. A product without dimensions in the master data falls into an undefined class, which the model treats cautiously — usually as a higher, not a lowered, cost threshold.
Benefits:
- Package cost is calculated at the level of the entire order, not the individual unit — just as the carrier actually charges it.
- A product without dimensional data does not disappear from the report and does not artificially lower the cost — it falls into an undefined class with a cautious, higher threshold.
- Dimensional and weight thresholds are configurable without intervening in the model logic, so adaptation to a change in the carrier’s price list does not require rebuilding the report.
FULFILLMENT: Basket Context Profile
It assesses the second, independent dimension of the same phenomenon: basket context, i.e. how many items travel together with a given SKU in one package. The model distinguishes single-item (solo) orders from two-, three- and four-item orders and from baskets of five or more products. This is purely operational information about picking, not about carton size — a product sold almost exclusively on its own has a completely different warehouse-work profile from a product regularly added to large orders, even if both fit the same dimensional class.
Benefits:
- It is visible which SKUs generate pick & pack work mainly on their own, and which almost always as an add-on to a larger basket.
- The average number of items in an order containing a given product becomes a measurable operational parameter, not the warehouse team’s intuition.
- The basket axis remains independent of the dimensional axis — one logistical problem (many items) is not mixed with another (a large package).
FULFILLMENT: Product Packing Profile Export
It combines both axes into a single profile per SKU: for every product that has reached a minimum number of orders in history (default three — below this threshold the percentage mix would be unreliable), it shows the percentage distribution — in how many orders the package had a given dimension, what weight class, and what the accompanying basket looked like. The result goes into a lightweight export covering the entire catalogue and the entire available period, ready to be joined with the rest of the financial model. The same SKU sold in a multi-item package enters the profile of every product in that package simultaneously — the profile serves the allocation of contribution margin per product, not a simple summation to the company-wide result without adjustment.
Benefits:
- Allocation of packing and shipping cost to contribution margin per SKU based on actual history, not on a single averaged rate for the entire catalogue.
- Fulfilment cost planning combines two independent sources: sales volume from the forecast and the historical mix of packages and baskets from this profile — carrier and packing rates remain the client’s decision.
- Product ranking shows directly which SKUs “pull” expensive fulfilment despite an apparently good trading margin, as well as the logistical context — solo vs multi — useful when planning warehouse work.
FORECAST — sales forecasts
FORECAST: Adaptive Demand Engine
Metis retrieves historical sales data and demand forecasts from Quantis. It forecasts sales at the level of an individual SKU, using the Quantis engine rebuilt with a layer of adaptive functions. The starting point is the observation that no single forecasting method works equally well for the entire assortment — a seasonal product, a product with stable demand and a newly introduced product require different statistical models. The module analyses the historical sales pattern of each SKU (seasonality, trend, variability, length of history) and on that basis selects the forecasting method appropriate for the given product, instead of imposing one model on the entire catalogue. The forecast result — sales quantity per SKU per period — feeds directly into STOCK: Weighted Average Cost Engine as sales_qty, which means that the quality of forecasting-method selection translates directly into the accuracy of inventory-issue valuation.
Benefits:
- An end to forcing a single forecasting method on the entire catalogue — a seasonal product and a stable product are calculated differently, just as they actually behave.
- A more accurate sales forecast means a more accurate valuation of inventory issues and a more reliable financial result for the period.
- Less time for the planning team spent on manually selecting a forecasting model per product.
FORECAST: Pattern Classification
An adaptive layer built on top of the Quantis engine — it classifies SKUs into sales patterns on the basis of the behaviour of the historical time series. The classification decides which forecasting method will be applied in FORECAST: Adaptive Demand Engine for the given product in the given period. Because a product’s sales pattern can change over time (e.g. a product leaving the market-introduction phase changes its demand characteristics), the module does not assign a method once and for all, but verifies the fit cyclically as new sales data arrive.
Benefits:
- The forecasting method keeps pace with the product, even when its sales character changes over time (e.g. a product leaves the market-introduction phase).
- No risk that a once-chosen method will “age” unnoticed and start quietly degrading forecast quality.
TEAM — employee master and employment cost
TEAM: Employee Master Registry
A central register of employees and contractors — one row per person, serving as the source of truth about who is linked to the company, on what terms and since when. It covers identification data, position, department, network/location (Retail Network), employment start and end dates, form of employment (full-time, B2B contract and others), social-insurance status and the employer’s PPK contribution rate. This is the same register that WAREHOUSE: Wages & Payroll Contributions Allocation refers to when building the employee key and assigning it to a division when allocating cost to warehouses.
Benefits:
- A single source of truth about employment — status, form of cooperation and organisational affiliation do not drift between the HR department and the financial model.
- Distinction of the form of employment (full-time vs contract) directly in the register allows different tax and cost treatment of different types of cooperation without manual exceptions in the formulas.
TEAM: Remuneration Timeline
It tracks the remuneration history of every person, not only its current value. In addition to the base rate it records up to two raises together with their effective dates, the currency of remuneration, the VAT rate for contractors invoicing, commission, bonus and the source of payment. Thanks to the date linked to every rate change, the module makes it possible to reconstruct how much a given person earned in any past month — not only today — which is a necessary condition for correctly recalculating wage costs retrospectively in WAREHOUSE: Wages & Payroll Contributions Allocation.
Benefits:
- Full history of raises per employee visible without searching through archival payrolls — a basis for analysing remuneration policy over time.
- Wage costs in historical reports are accurate for each month separately, not calculated retrospectively at the current rate.
- B2B contractors are settled correctly with respect to VAT, without manually distinguishing them from full-time staff in the cost calculation.
TEAM: Total Employment Cost (Benefits Basket)
It extends employment cost beyond the salary itself by a full basket of non-wage benefits assigned individually to each person: equipment (laptop, phone), cost of the office workstation, SaaS tools, sports card, team-building budget, wellness/mental-health support, training and certification budget, parking, relocation package, public-transport card, medical package, childcare support, D&O insurance and additional discretionary bonuses. Each item is a separate field, so the total cost of employment of a given person can be broken down into exactly the components of which it really consists.
Benefits:
- The true, full cost of employment — not only gross salary — visible per person, department and warehouse, without omitting “small” benefits that in aggregate can be a significant amount.
- It is easy to calculate how much the company actually spends on benefits per employee and to compare this across departments or locations.
- Decisions on standardising or cutting a specific benefit (e.g. the sports card) can be based on the real total of its cost across the organisation, not on intuition.
TEAM: Termination Cost Modeling
It calculates the cost exposure associated with ending employment. On the basis of the notice period and the remuneration rate, the module makes it possible to estimate the cost of the departure of a given person or group of people — taking into account the planned employment end date where it is already known. This is direct support for restructuring decisions: a headcount reduction in a given department or warehouse has an immediately calculable, not estimated, cost.
Benefits:
- The cost of a possible headcount reduction is known in advance, before the decision is taken — not as a surprise on the payroll.
- Planning a team restructuring (e.g. closing a warehouse) can be based on the real cost of the notice periods of the entire affected group.
TEAM: Vehicle & Asset Assignment
It assigns an employee to a concrete fleet asset via the EFAR identifier. This is a direct link between the team master and EFAR: Asset Activity Profiles — the cost of maintaining a given vehicle (fuel, service, parts) can be traced not only to a warehouse or division, but to the concrete person whom that vehicle serves.
Benefits:
- Fleet cost is accountable at the level of “who uses it”, not only “how much the fleet costs as a whole”.
- It is easier to assess the justification for assigning a specific vehicle to a specific position by looking at its real maintenance cost.
CONTROL — controlling the cost activity window
OpEx: Activation Window Gate
A control layer superior to the cost modules of the Metis system. Before any module calculates a cost for a given period, it checks in the OpEx register the activation gate assigned to it — the start and end dates within which the given cost may occur at all. This is a single, shared mechanism that simultaneously handles several different business phenomena: a campaign active only in a defined time interval, a cyclical cost occurring in specific repeating windows, and a seasonal cost limited to part of the year. Instead of each cost module building its own logic of “should I calculate anything in this month at all”, it queries one common gate in OpEx — which means that a change in the activity period of a given cost (e.g. shifting a campaign, extinguishing a contract) is a single change in a single place, visible immediately in all modules that use that cost.
Benefits:
- Switching costs on and off over time (campaigns, seasonal contracts, fixed-term agreements) is controlled from one place, without modifying formulas in the target modules.
- The same mechanism handles three phenomena that are different in nature — time limitation, cyclicity and seasonality — without the need for separate logic for each of them.
- An error of the type “the cost was charged in a month in which it should not have been” is diagnosable in one place (the gate in OpEx), not in each module separately.
TRAFFIC — traffic acquisition costs (WebTraffic)
TRAFFIC: Prospecting Cost Engine
It calculates the cost of acquiring new traffic for a given campaign in a given month — the product of the number of visits (traffic) and the cost per click (CPC), each with a separate annual percentage correction (e.g. year-on-year increase in CPC rates). A campaign has a defined closed activity interval (start and end date), outside which the cost is not charged. The annual correction makes it possible to model a change in traffic prices (ad auctions, CPC inflation) without manual revision of the base monthly table — a single coefficient per year is sufficient.
Benefits:
- A forecast of traffic-acquisition cost several years ahead without manually filling a separate monthly table for each year — a single annual correction factor is enough.
- A change in the advertising platform’s pricing strategy (CPC increase) is modelled with a single parameter and immediately visible in the marketing-cost forecast.
- Campaigns of limited duration (e.g. a seasonal promotion) automatically stop generating cost after the end date, without manual deactivation.
TRAFFIC: Remarketing Pool Engine
It calculates the cost of remarketing — i.e. reaching again people who visited the site in the recent past but have not yet converted. The mechanism builds a “pool” of potential remarketing recipients as the sum of traffic from the last N months back (N results from the campaign retention period, converted from days to months), where traffic from each historical month is corrected by the annual coefficient proper to itself — not by the coefficient of the current period. From this pool only a part (Match Rate) is actually matchable to a recipient (limitations of advertising platforms in matching users), and the cost of reaching the matched part is calculated at a separate remarketing CPC rate, also corrected annually.
Benefits:
- Remarketing cost rises and falls naturally with the volume of traffic from previous months, instead of being a fixed budget amount detached from reality.
- Different campaigns can have a different retention period (how long a visitor remains in the remarketing “pool”) and a different Match Rate, reflecting real differences between platforms and audience groups.
- Correct application of the annual correction per historical month (not per current month) prevents distortion of cost for campaigns spanning several years.
WAREHOUSE — warehouse cost allocation
WAREHOUSE: Allocation Keys
A central register of allocation keys for the entire warehouse network. For each warehouse it defines which employee divisions and which cost items (CapEx, OpEx, financial liabilities) are assigned to it and what percentage of a given item or a given division falls on it. One division or one cost item can be assigned to multiple warehouses simultaneously with a different percentage for each — reflecting the operational reality in which a team or a lease contract serves more than one location. All other WAREHOUSE modules read their allocation key from this register.
Benefits:
- A single place to manage allocation keys for the entire warehouse network — a percentage change in one place updates all linked reports.
- It reflects the operational reality in which one team or one contract serves several locations at once, instead of artificially assigning the cost to a single warehouse.
WAREHOUSE: Wages & Payroll Contributions Allocation
It calculates the full personnel cost assigned to the warehouse. For each employee it builds a unique key (first name, last name, employment date) on the basis of TEAM: Employee Master Registry and matches it to seven independent payroll registers: basic salary (consistent with the rate history from TEAM: Remuneration Timeline), accident insurance, disability insurance, pension insurance, Labour Fund, FGŚP and PPK. The values of all employees belonging to a given division are summed simultaneously (matrix multiplication instead of looping over employees), and the division sum is multiplied by the allocation percentage from WAREHOUSE: Allocation Keys. Unlike the other WAREHOUSE modules, the allocation key here operates at the level of organisational structure (division), not a single cost item — personnel cost by nature cannot be assigned item by item.
Benefits:
- The full cost of employment (not only salary, but also contributions and funds) is allocated to the correct warehouse automatically, without manually calculating “who spends how much time where”.
- The warehouse cost account ceases to omit what is usually the single largest operating cost — people’s work.
- A change in team composition (new hire, departure) immediately translates into an updated warehouse cost, without a separate report update.
WAREHOUSE: CapEx Allocation
It allocates to the warehouse a share of capital costs settled centrally — fleet, equipment, investment infrastructure. For each item assigned to the warehouse the module searches five independent source registers (fuel, service, spare parts, energy, CapEx cash data), assuming that the given item appears in exactly one of them. The found value is multiplied by the allocation percentage from WAREHOUSE: Allocation Keys. This is the most indirect of the four warehouse cost types — a CapEx item is not generated by the warehouse directly, but is allocated to it from a common pool. Four of the five searched registers (fuel, service, spare parts, energy) and the CapEx cash data come from EFAR — the module described below, which calculates these costs at source, at the level of a single asset.
Benefits:
- The company’s investment costs cease to be “invisible” to individual warehouses — each sees its real share.
- Automatic searching of five source registers eliminates manual hunting for the system in which a given item was booked.
- A basis for informed decisions on fleet or infrastructure investments per location, not at the level of the whole company.
WAREHOUSE: OpEx Allocation
It allocates current operating costs — the only cost type in the WAREHOUSE module taken from a single dedicated register instead of searching multiple sources. This reflects the character of OpEx as a cost more directly linked to a given warehouse than CapEx or financial liabilities. The mechanism of matching items and multiplying by the allocation percentage is identical to that in the other cost modules.
Benefits:
- Current warehouse costs are visible separately from the company’s common costs — it is easy to assess what the warehouse actually generates itself.
- A simple, predictable data structure facilitates a quick month-end close without manual reconciliation of items.
WAREHOUSE: Financial Liabilities Allocation
It allocates to the warehouse a share of the servicing of centrally contracted debt — lease instalments, interest on investment loans. The structure is identical to WAREHOUSE: OpEx Allocation: a single source register, matching of item and month, multiplication by the allocation percentage. Together with CapEx it constitutes the second type of indirect cost in the warehouse matrix — a cost generated by the company’s financial decisions, not by the current activity of the warehouse itself.
Benefits:
- Financing cost is visible per warehouse, not only as a single aggregate item in the company-wide balance sheet.
- Clarity on how much of warehouse profitability is “eaten” by the servicing of debt contracted at the central level.
WAREHOUSE: Cost Matrix Output
It assembles the results of all four cost modules (Wages, CapEx, OpEx, Financial Liabilities) into a single table: cost item or division × category × allocation percentage × value in each month of the reporting period. This is the output document for a given warehouse — a direct input to the profit-and-loss account per location, making it possible to distinguish direct costs (OpEx) from indirect costs (Wages, CapEx, Financial Liabilities) at a glance.
Benefits:
- One table instead of four separate reports — management sees the full warehouse cost without manually assembling data from different sources.
- A ready, coherent cost base for comparing warehouses with one another — the same calculation method for every location.
- Distinction of fixed (indirect) and variable (direct) costs facilitates decisions on scaling the warehouse network.
EFAR — asset costs broken down by activity
EFAR: Asset Activity Profiles
It calculates the costs of maintaining the company’s assets (fleet, machinery, equipment) at the level of a single asset, not a collective cost pool. Every asset has its own consumption profile — fuel or energy, service costs, spare parts — broken down month by month, independently of which warehouse or which division it will ultimately be allocated to. This activity-based approach addresses the same limitations that in classic budgeting lead to cost dilution: instead of a single sum “fleet costs” for the whole month, EFAR knows exactly how much a concrete asset cost in a concrete month and under which heading. The result feeds WAREHOUSE: CapEx Allocation as one of the five searched sources — a cost item from the allocation table is matched to the profile of the asset it concerns.
Benefits:
- An end to a single collective sum “fleet costs” — it is known exactly which asset generates what cost and under which heading.
- It is easier to identify assets that have ceased to pay off (e.g. rising service costs of an ageing vehicle).
- A basis for informed decisions on equipment replacement, based on real, not estimated, maintenance costs.
EFAR: CapEx Cash Data
It keeps records of cash flows related to capital investments — acquisition of assets, instalments, own contribution — separately from the current maintenance costs calculated in EFAR: Asset Activity Profiles. This distinction has accounting and liquidity significance: an investment expenditure affects cash flow in a different rhythm from the operating cost of maintaining the same asset. Data from this module are one of the five source registers queried by WAREHOUSE: CapEx Allocation.
Benefits:
- An investment expenditure is not mixed with the current maintenance cost of the same asset — liquidity and profitability are calculated correctly, separately.
- A clear picture of cash liabilities arising from investments, useful when planning the company’s cash flow.
ECON — economic trends
ECON: Currency & Rate Trends
A central, updated table of exchange rates (EUR/PLN, USD/PLN, GBP/PLN, CNY/PLN) in a monthly layout, serving as the sole rate source for the entire Metis system. Every module converting foreign-currency values — STOCK: Purchase Order Costing, STOCK: Customs & NBP Rate, EFAR: Asset Activity Profiles — queries the same register, selecting the rate according to the month of the relevant event (payment, transport, asset purchase), not according to a single reference date for the entire transaction. This unity of rate source eliminates the risk that two modules will calculate the same currency transaction at different rates.
Benefits:
- A single source of truth for exchange rates across the whole model — zero risk that two reports will show a different value for the same transaction.
- Updating the rate table once a month is enough for the entire system to recalculate correctly, without manually entering every sheet.
ECON: Financial Cost Indices
A table of interest rates and financing-cost indicators (e.g. WIBOR, credit margins, lease terms) in a monthly layout analogous to the exchange-rate table. It constitutes the data source for WAREHOUSE: Financial Liabilities Allocation — the cost of servicing warehouse debt is not a fixed value entered once, but is recalculated on an ongoing basis according to the current or forecast rate from this register.
Benefits:
- Warehouse financing cost reflects real, current market conditions, not an assumption from a year ago entered once into the budget.
- A change in the interest rate is visible in the warehouse result immediately, without waiting for a manual model revision.
ECON: Fuel & Electricity Price Trends
A table of fuel and electricity prices in a monthly layout, feeding EFAR: Asset Activity Profiles and — for warehouses with elevated energy consumption, e.g. refrigerated warehouses — directly the warehouse operating cost in WAREHOUSE: OpEx Allocation. Metis is a universal model: it does not assume a uniform energy-consumption profile for the entire network, but allows each warehouse to have its own actual share of energy cost, dependent on its operational characteristics (e.g. a cold store consumes incomparably more energy than a dry warehouse of the same size).
Benefits:
- Refrigerated warehouses and other energy-intensive locations have their real energy cost reflected in the result, instead of an averaged rate for the entire network.
- An increase in fuel or energy prices is visible in warehouse and fleet costs automatically, without manual budget revision after every rise.
ECON: Forward-Looking Sensitivity
The ECON registers store not only current values but also planned changes for future periods — an interest-rate increase, an energy-price rise, a change in the exchange rate. Because every cost module queries ECON per period, not per a single fixed value, a planned change in any register automatically propagates through the entire calculation chain in the month to which it applies — without manual updating of formulas in the cost modules. The same logic is applied on the revenue side: FORECAST: Adaptive Demand Engine tracks both current and planned product sales prices by the same mechanism that ECON tracks cost prices. The effect is immediate visibility of the impact of any planned change — cost or revenue — on the contribution margin of the product and the warehouse in the period in which the change will take effect, before it actually occurs.
Benefits:
- Management sees the impact of a planned increase in energy prices, interest rates or the exchange rate on margin before that increase actually takes effect.
- Pricing and cost decisions are taken in advance, on the basis of numbers, not gut feeling.
- A single mechanism handles both the cost and the revenue side — “what-if” scenarios are calculated consistently across the whole model.
ARCHITECTURE — dynamic scaling and seamless server integration
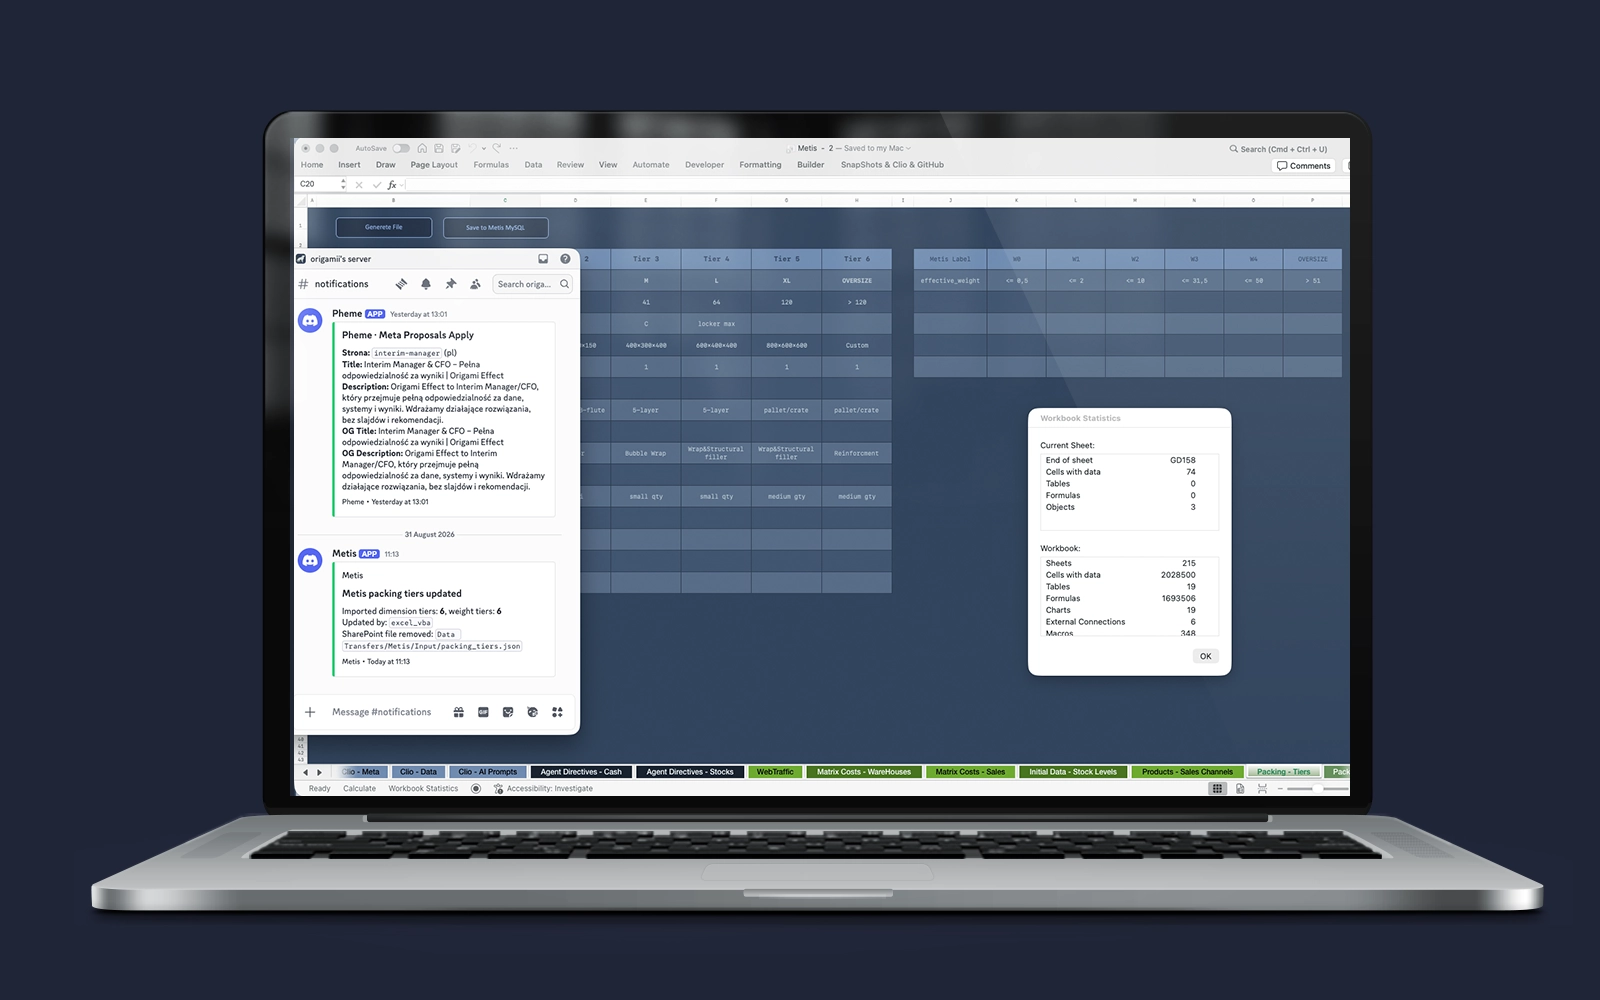
Metis is not a static file — it is a flexible architecture integrated with a dedicated server application that automatically adjusts the size and structure of the financial model to the scale and number of the client’s SKU catalogue. Updating parameters, recalculating a scenario or exporting results to the database from within Excel takes only a moment. The entire process runs in the background, and the user and the operational team immediately receive an automatic Discord notification with a detailed summary of the action performed (e.g. updated packing thresholds or a JSON data transfer). Thanks to this the Excel model works in full synchronisation with the company’s cloud infrastructure.
Benefits:
- Automatic scaling (Dynamic Sizing): The model automatically adjusts its weight and calculations to the size of the client’s product catalogue — without loss of performance.
- Instant server synchronisation: A single click is enough to send the calculated data to the MySQL database and connect the model with the backend application.
- Real-time Discord notifications: The team receives immediate alerts about every update, parameter change or file transfer.
Do you need a model that links purchasing decisions with results and liquidity?
Origami Effect designs financial-operational models on the basis of the company’s real data and processes.