Your data exists.
It just does not talk to each other.
Origami Effect analyzes your company and its processes, builds dedicated Excel tools your employees already know, and Clio connects it all into one coherent data system.
A report gets created only when someone finds time to assemble it.
An invoice goes into one spreadsheet. Budget into another. Operational data into a third. To produce one report, someone manually collects, merges, and validates everything. Every month. From scratch.
At that moment, this person creates no value that was not already present in the data.
How it works now
- Data lives in multiple Excel files and in employees’ heads
- Reporting requires manual monthly assembly
- Training overhead, employees spend weeks learning new tools
- No single source of truth for management
- Historical data is hard to retrieve
After implementation
- Employees work in Excel they already know, using ready tools
- Clio captures data automatically after approval
- Reports are generated by schedule or trigger
- Management sees current performance without opening files
- Full data history in one place
System architecture: three layers built from the ground up.
Each layer adds value the previous one cannot deliver on its own.
Analysis is always the starting point. It includes analysis of your company and process flows: where data comes from, who needs it, and which decisions it must support. Only then the architecture is designed.
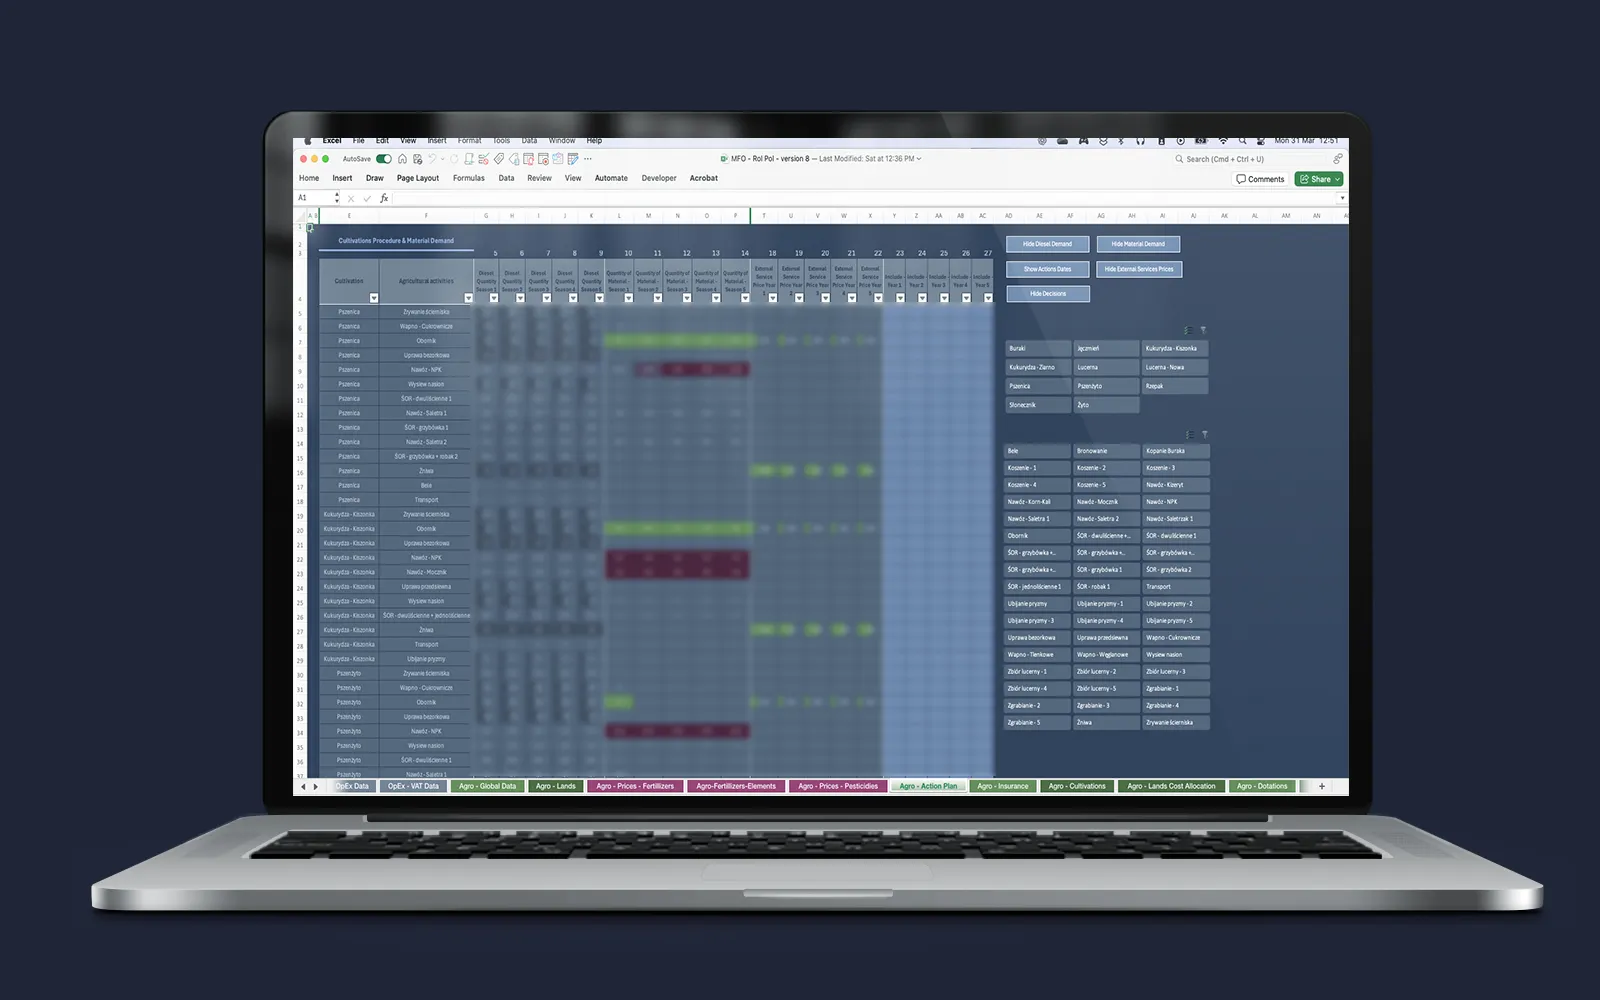
Layer 1: Excel applications
Dedicated Excel tools tailored to each process. Employees receive ready tools, not training programs.
Tool examples: Gaia | Hebe | Echo | Demeter | Quantis Logistics
Layer 2: Clio
Data orchestration and collection. Clio captures data from all Excel tools, stores it in MongoDB, and runs reporting and alerts automatically.
Layer 3: Iris
Interactive React dashboard launched when periodic reports are not enough. Data updates in real time, with AI agent support for natural-language questions.
Step 1 – Operational layer
Dedicated Excel applications: ready tools for employees, not training programs.
Below are implementation examples (scope showcase, not a closed list):
Gaia
Agrotechnical treatment tracking, technical production cost logic, and PPP documentation for agriculture.
Hebe
Milk and herd operations data capture for animal production.
Echo
Invoice and purchasing document registration at point of entry with full process context.
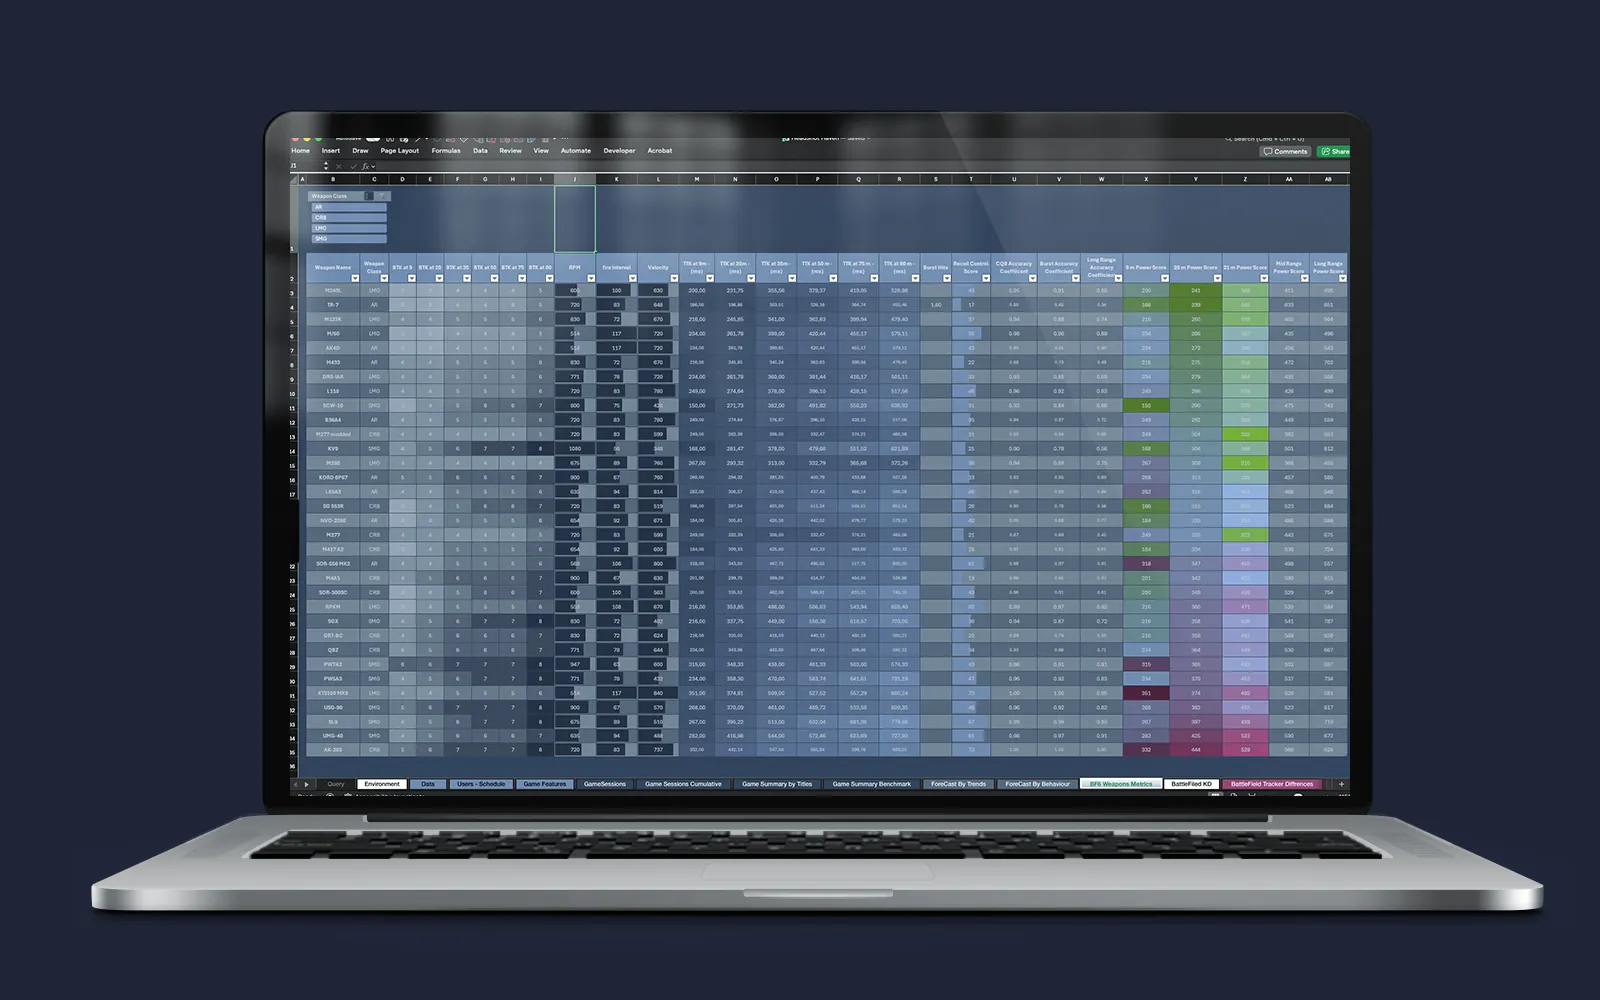
Themis
Multidimensional market analytics with automation pipelines.
Quantis Logistics
Advanced planning and execution system for inventory, purchasing, and sales forecasting.
Your process
If your process is not listed, Origami Effect can design the right tool for it.
Step 2 – Core system layer
Clio is the data orchestration engine.
It captures data from all key Excel applications at approval point and stores it in a central MongoDB structure with full context and real-time availability.
The company starts collecting and preserving data in one place. For the first time.
Employee approves data in Excel app
Gaia, Hebe, Echo, whichever process they own. Familiar interface, no tool switch friction.
Weekly payments digest
Every Monday at 7:00, automatically, without manual effort.
Project stage report
Generated when the stage closes, not when someone finds free time.
Alerts are sent where people are: WhatsApp, Slack, Teams, Discord, email.
Sample alerts: invoice overdue by 3 days, budget exceeded above threshold, contract expiring in 60 days, missing required data in time-critical flow.
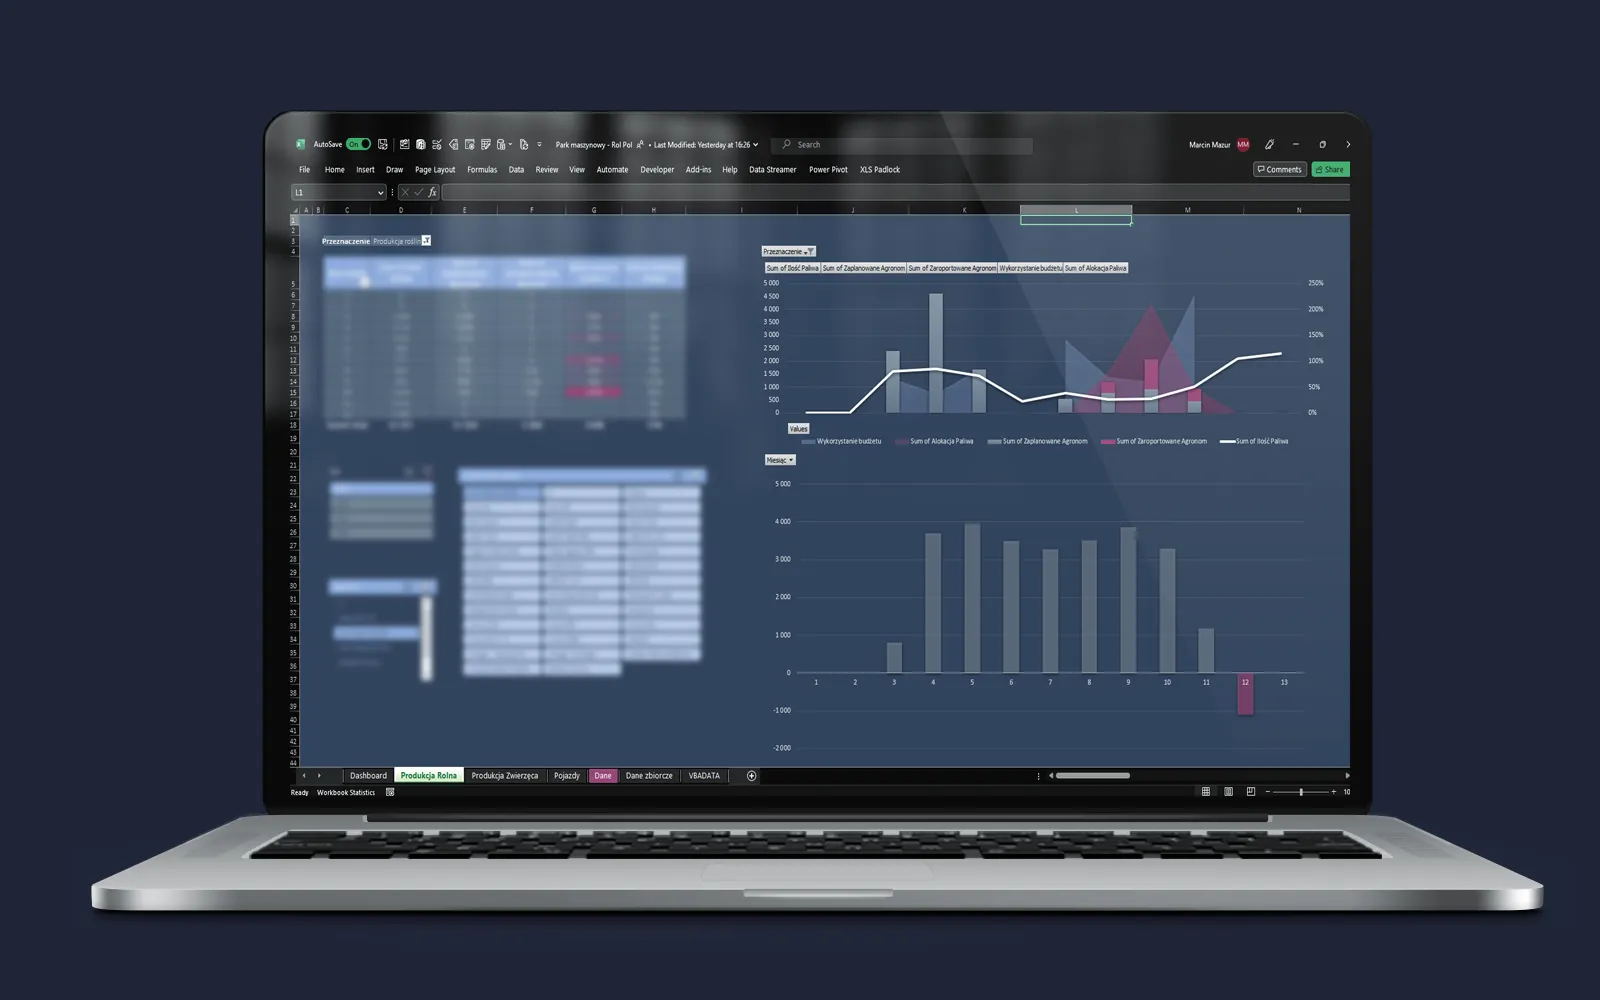
Step 3 – Iris, live React visualization (optional when reports are not enough)
Iris is launched when periodic reporting is not enough, when owners need live company state at any moment, not only on report day.
Iris is an interactive React dashboard directly connected to Clio MongoDB layer. Data updates as soon as employees approve records. Every number is drillable.
The built-in AI agent answers natural-language questions, not by estimating, but using numbers already computed by the system.
AI-ready foundation from day one
Structured, clean, and consistent MongoDB data is exactly the foundation AI agents need to work without hallucinating.
Clio solves distributed-data chaos before any AI model is even introduced.
Best fit where reporting still depends on people stitching spreadsheets.
Example implementations
- agriculture and animal production
- real estate portfolio operations
- investment project governance
- service companies running multiple projects in parallel
- organizations without ERP that still require advanced operational analytics
If your industry is not listed
- write to us and describe your context
- if data lives in Excel files and employee memory, this is the right path
- if reports are created only when someone has time, automation will deliver immediate impact