
Joint Venture Financial Model
The model allows calculation of future profit in a joint venture project, taking into account the contributions of both parties, risk, and schedule. The scope also includes financial parameters of services on the B Entity side.
Introduction to the joint venture project financial model
The presented financial model was prepared for the needs of negotiating cooperation terms in a joint venture formula between two entities: a company providing customers through its own marketing channels (Entity A) and a company providing online financial services (Entity B).
The goal of the model was to create a transparent tool enabling:
- determination of the value of resources contributed by each party,
- analysis of the profitability of cooperation for both parties,
- dynamic negotiation based on numerical data,
- quick modification of model parameters and observation of their impact on results.
Project assumptions:
- promotion period,
- flat fee rate,
- profit share level and its duration.
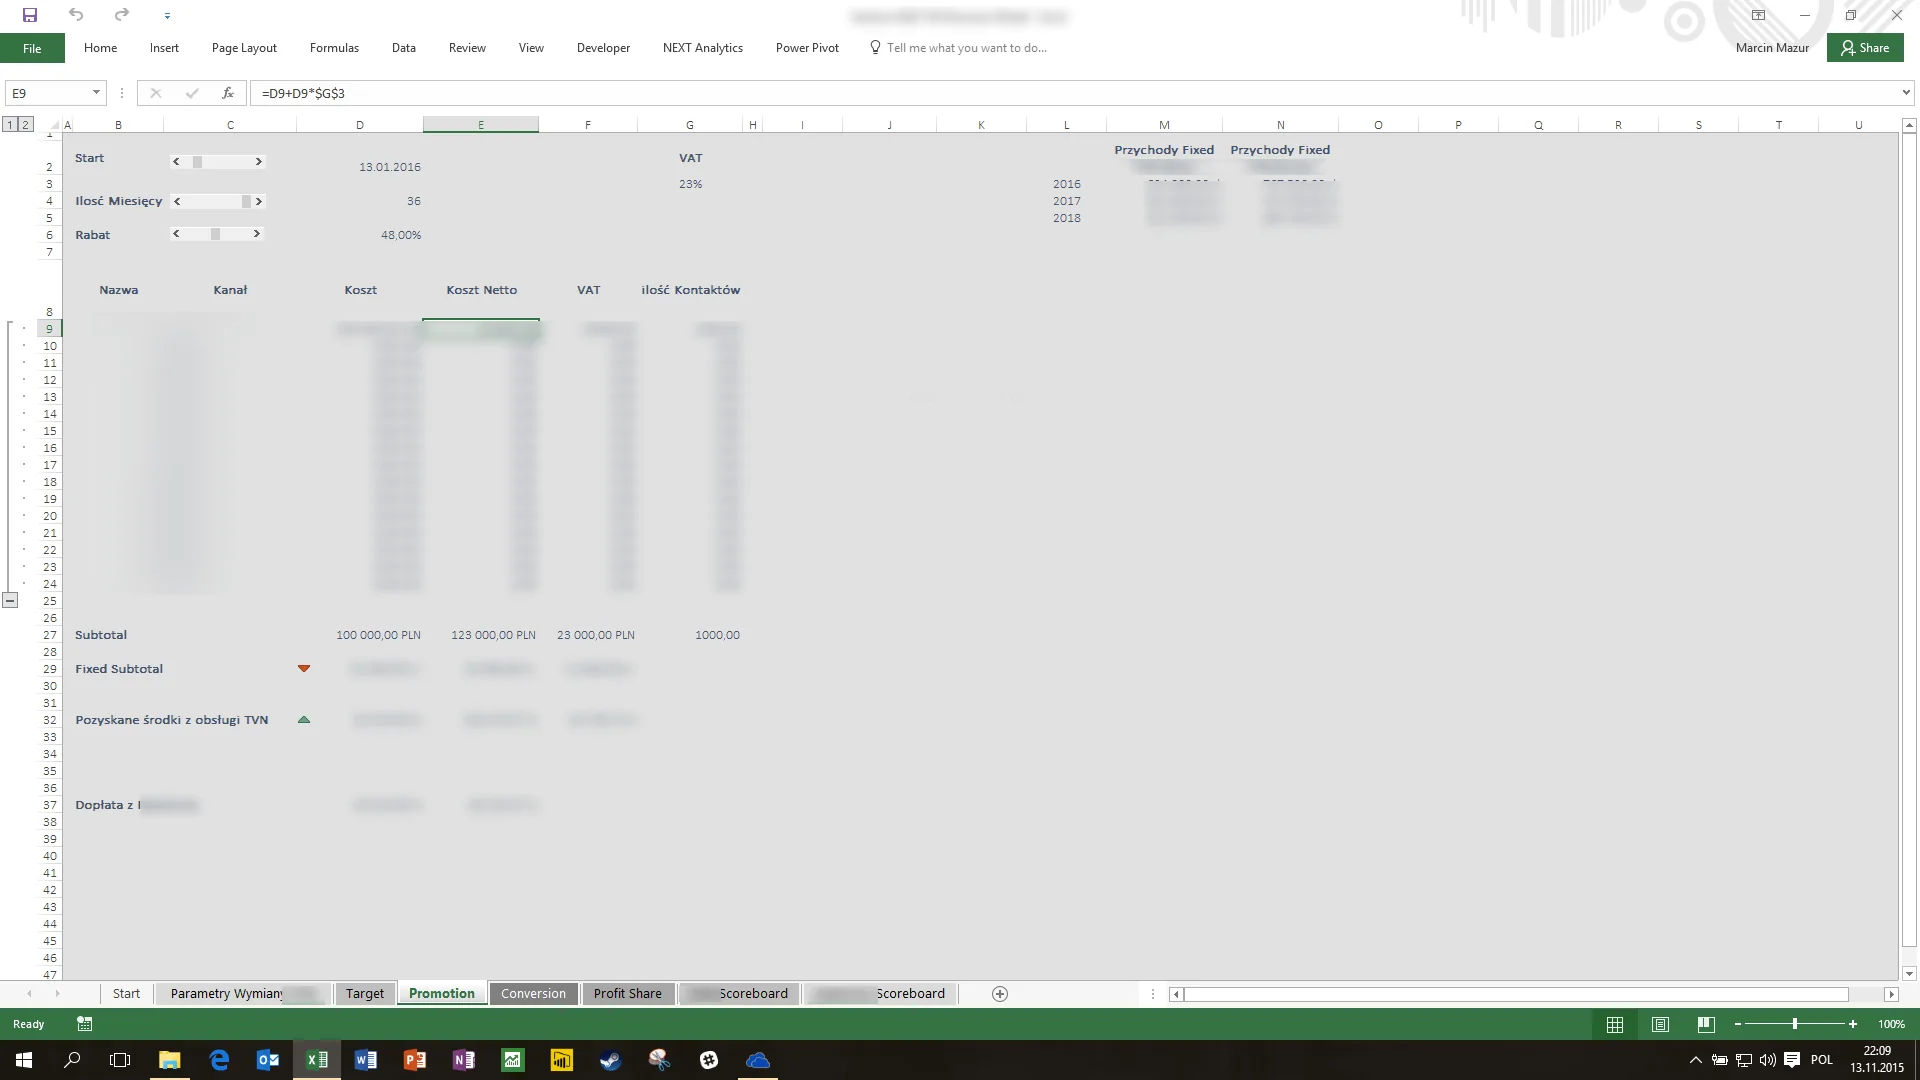
Marketing section
- Ability to enter parameters for 16 different marketing channels.
- Separate Rate Card rate and discount value for each channel.
In this section of the financial model, Entity B provided data on the historical distribution of the service in the population, which made it possible to determine the potential target and market shares in individual segments.
Additionally, estimates of achievable operating margins depending on the customer segment were presented. This information was used in the model to analyze the profitability of cooperation and potential financial results of the project.
The model includes:
- Population share structure according to Entity B data,
- Range of possible operating margins depending on the customer segment.
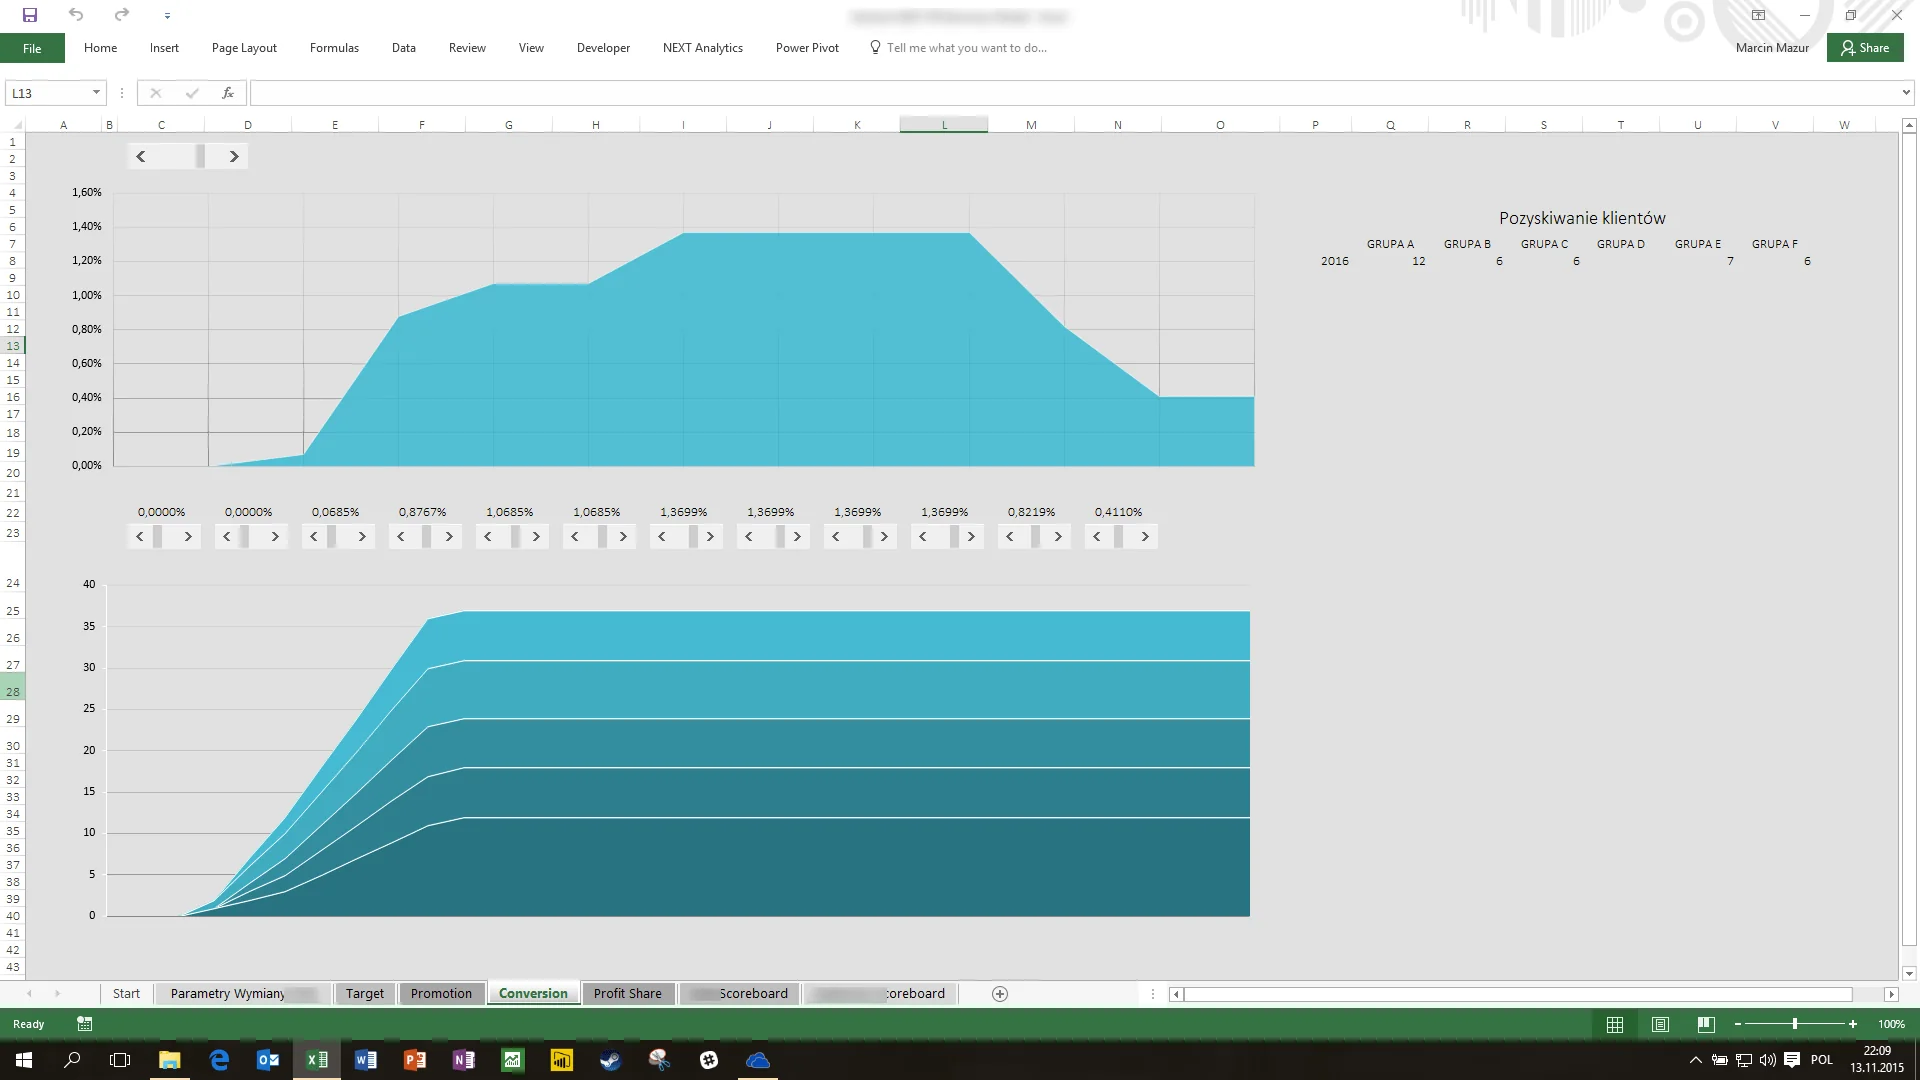
Conversion parameters – input data (Entity A)
At this stage of the financial model, assumptions proposed by Entity A regarding lead conversion to final customers were used. These parameters were entered as control variables that influence further business value forecasts.
In particular, the model enables:
- Entering assumptions regarding sales activity efficiency – from leads to customers,
- Automatic recalculation of the number of acquired customers over time,
- Estimation of business value resulting from customer base growth in different segments.
This is a key component of the model – it allows assessment of the potential scale of the project depending on the assumed operational effectiveness.
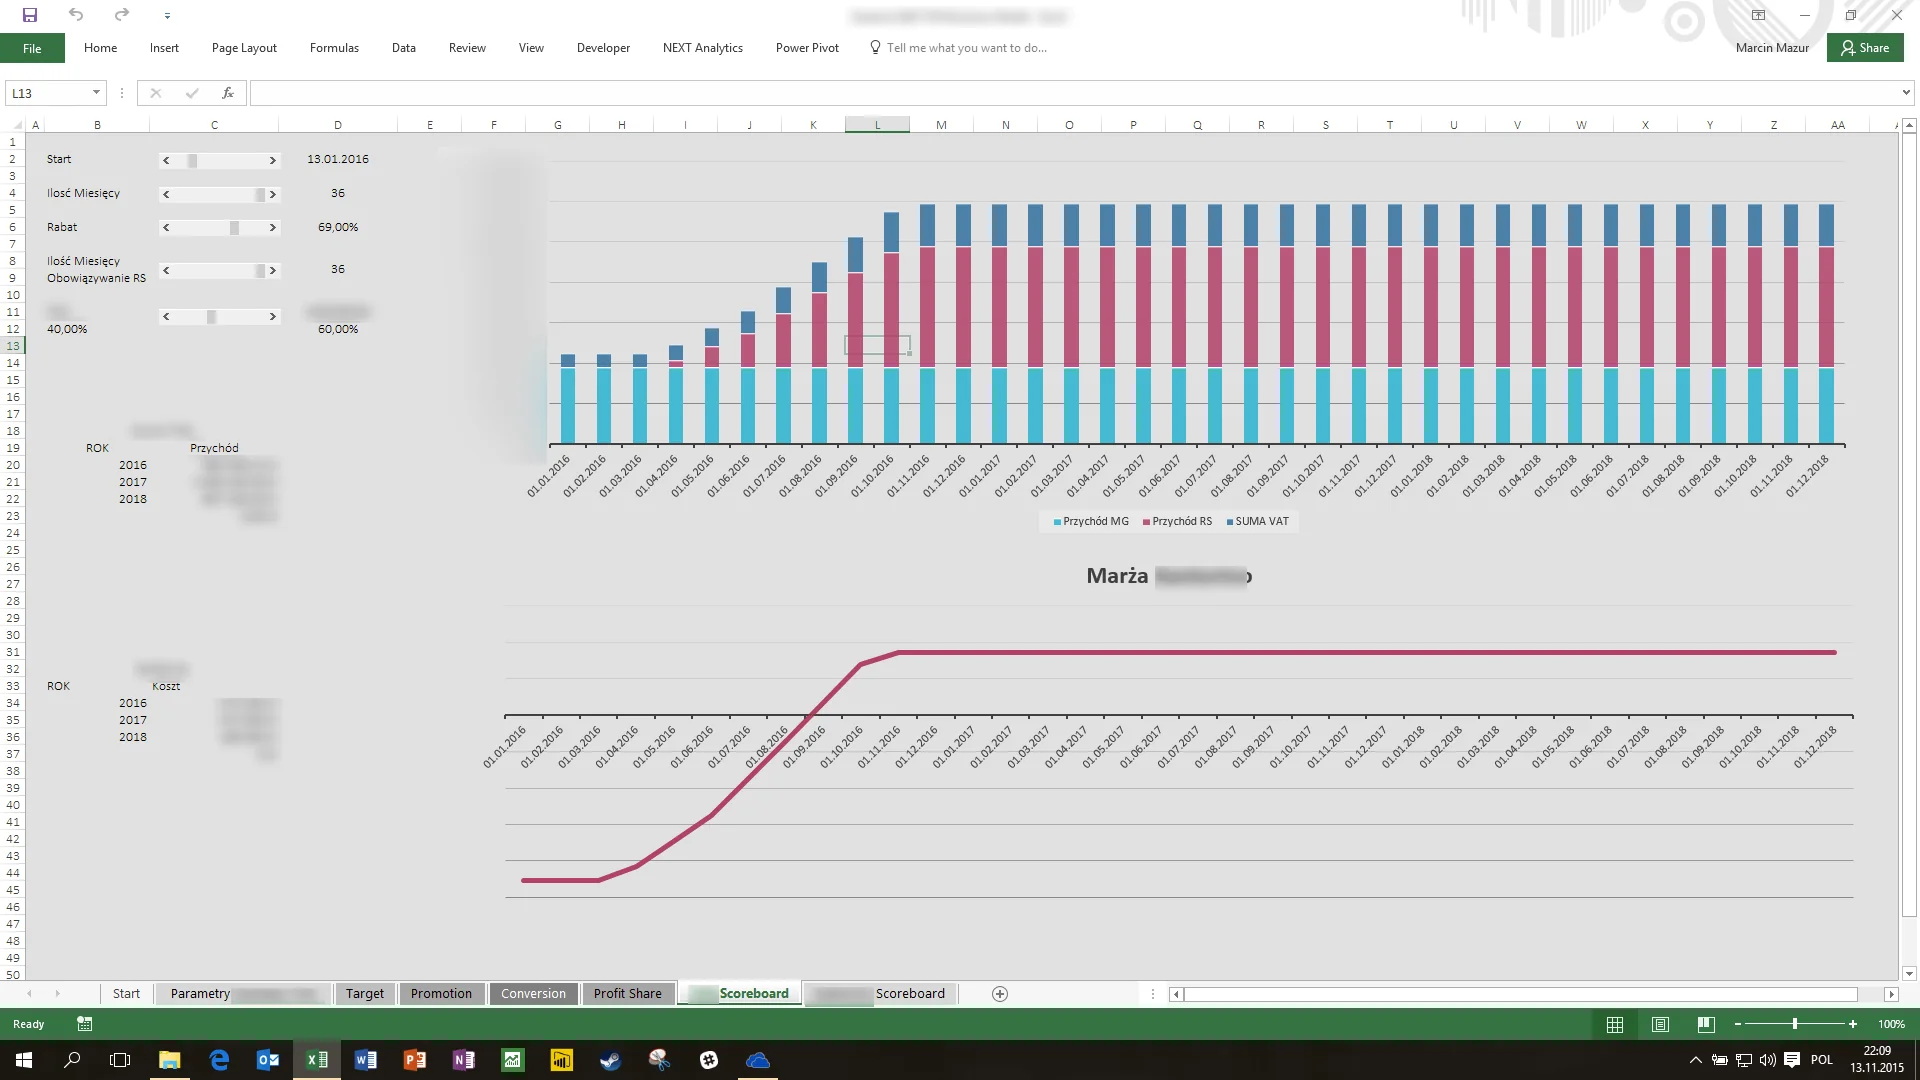
Negotiation dashboard – dynamic space for testing cooperation terms
This tool enables business negotiations based on specific, measurable data. Within the dashboard it is possible to:
- Interactively test different cooperation and value-sharing scenarios,
- Modify parameters such as: contract length, rate levels, operating margins, and net and gross values,
- Immediate analysis of the impact of changes on financial efficiency – both globally and broken down by target segments,
- Clear visualization – charts and tables allow quick identification of which variants are more beneficial for both parties.
This module played a key role in the negotiation process – it allowed moving away from generalities and conducting discussions at the level of hard data.
Analytical view (Entity A) as an advertising services provider
It was also possible to make changes to the business model regarding:
- determining the project launch date,
- determining the duration of profit share,
- determining the percentage discount value on the promotional channel,
- percentage value of profit share.
Total revenues possible to obtain by Entity A are also visible, with details for:
- marketing channels,
- VAT rate,
- and participation in profit share.
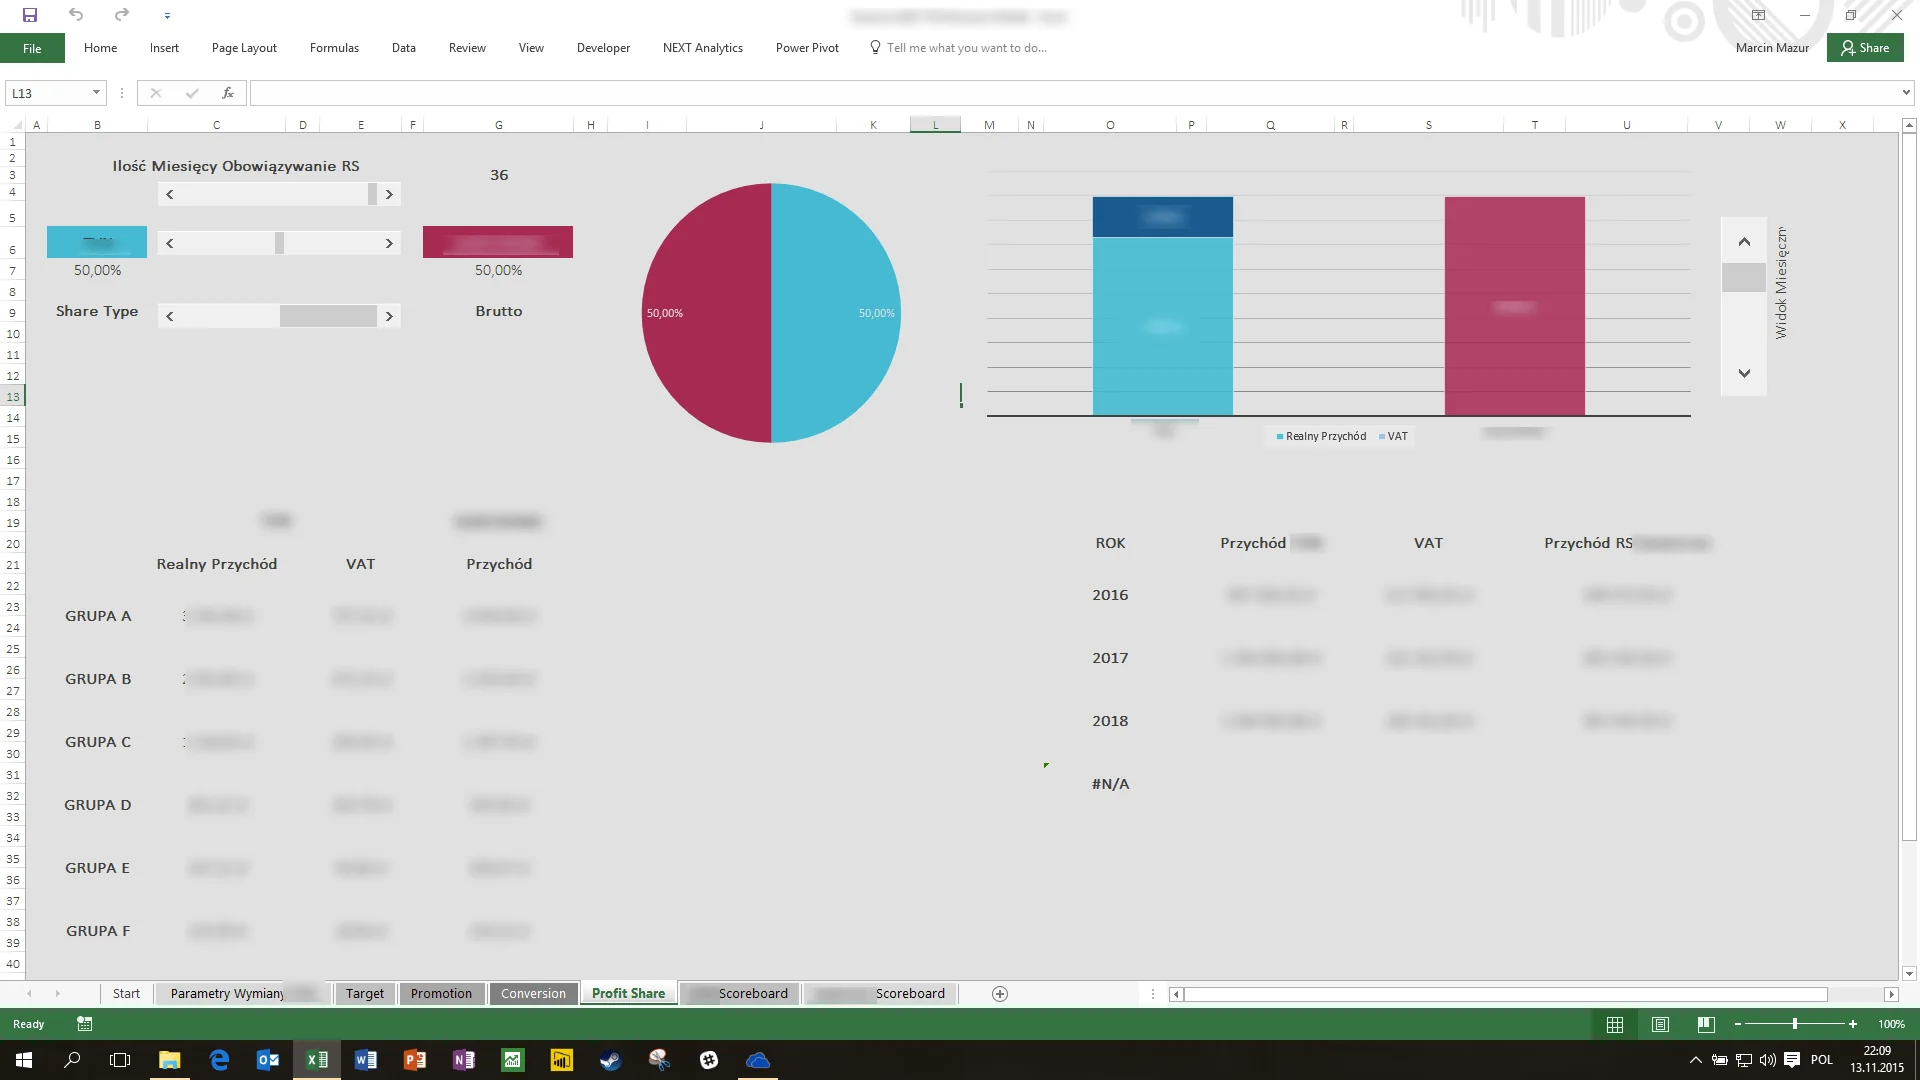
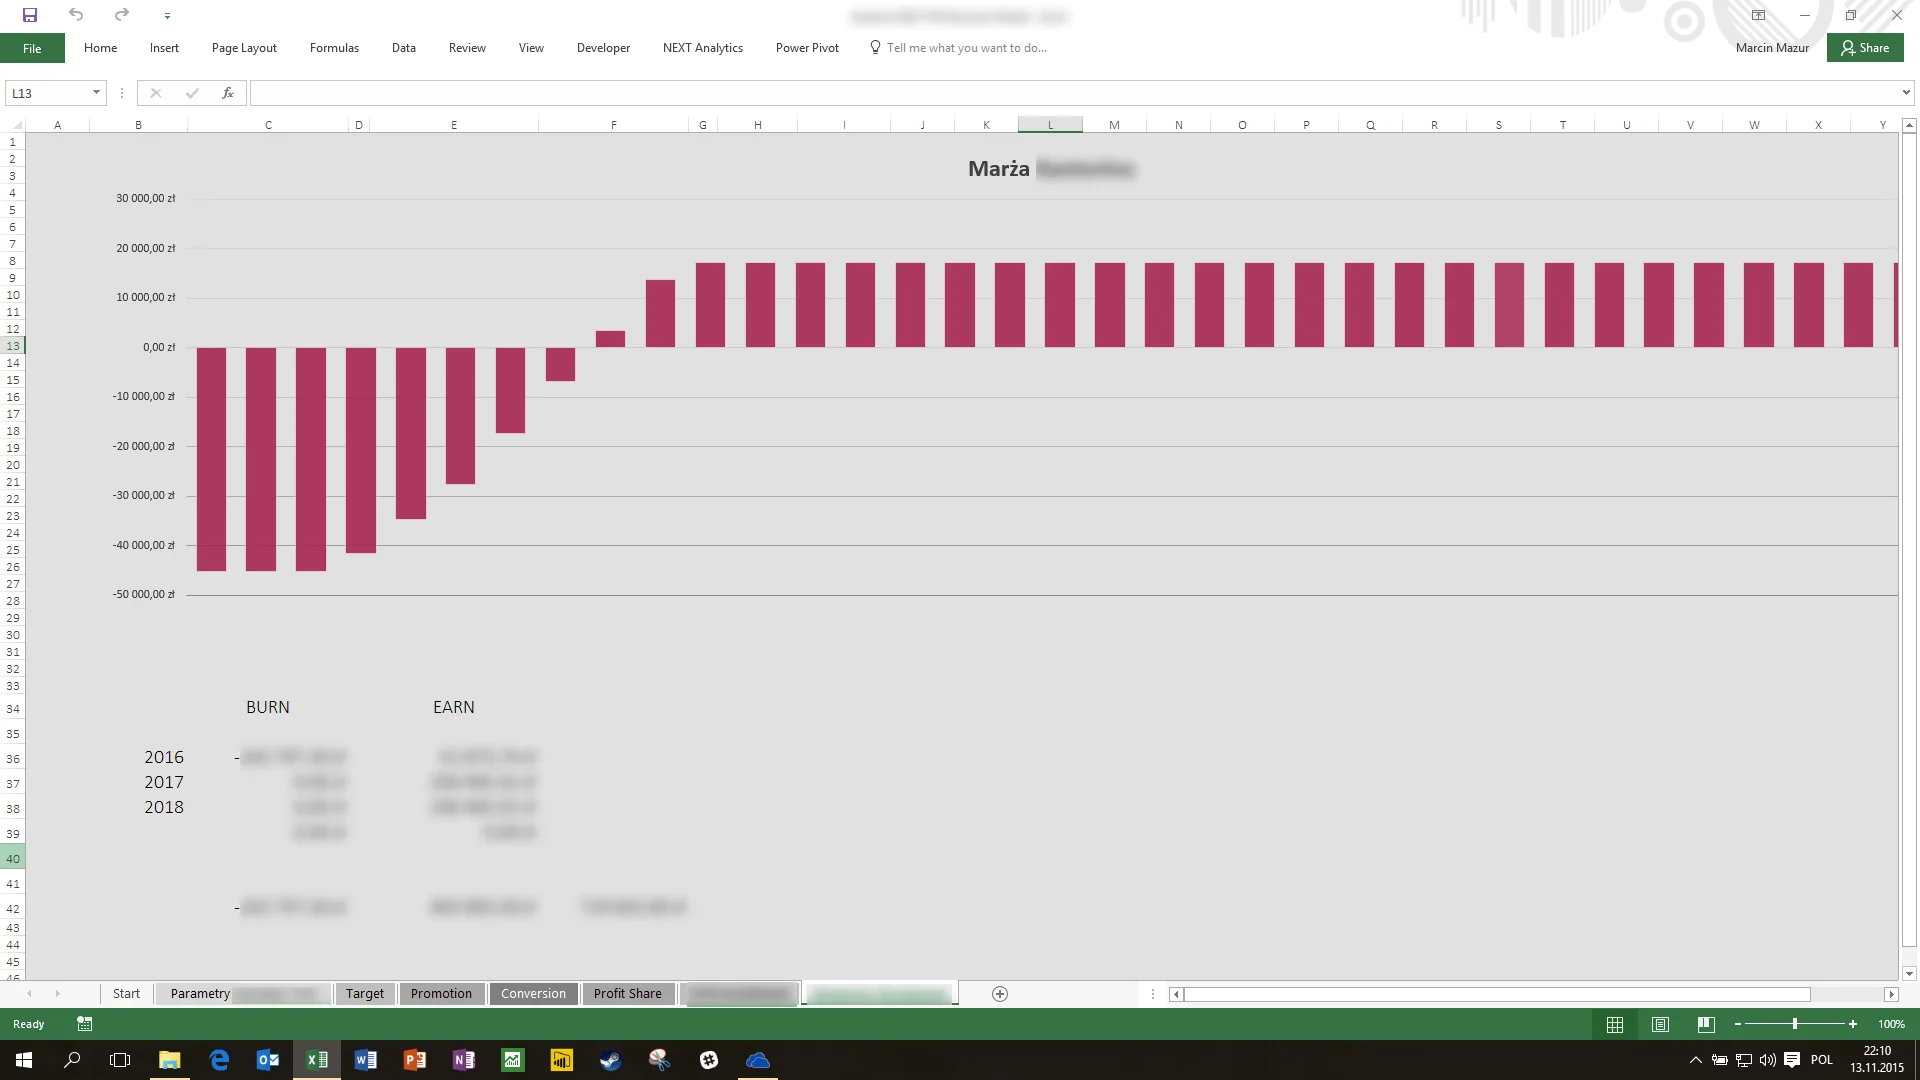
Analytical view (Entity B)
Each partner could analyze their share in the transaction – the model presented the share in net profits, assigned costs, and margin level depending on the customer group and acquisition channel.
The charts enabled quick comparison of different offer variants.
The model was used to conduct professional business discussions and negotiations between partners.
Thanks to it, each party could dynamically assess the impact of changing individual parameters on the profitability of cooperation and build win-win scenarios.
The model was designed in Excel using advanced dynamic recalculation mechanisms and interactive parameter control.
Do you need someone who instantly understands the problem — and knows what to do with it?
Most companies have data. What’s missing is the idea of what to do with it — and someone who will actually execute it. Origami Effect provides both.