
Financial analysis including determination of the technical cost of production
Project objective:
To conduct an in-depth financial analysis of the operational activities of a large agricultural enterprise, with the aim to:
- identify areas for efficiency improvement
- determine the Technical Cost of Production (TCP) for crop and livestock activities
Scope of activities:
-
A historical financial analysis of the agricultural company was carried out, covering data from several years (including invoices, SAF-T/JPK files, and internal reports).
-
Direct costs were defined for each business line: crop cultivation and milk production.
-
The structure of the Technical Cost of Production (TCP) was developed separately for crops and milk, with a full breakdown of costs for materials, labor, machinery, fuel, energy, and depreciation.
Outcome:
- A coherent cost structure was developed, enabling reporting by business activity and product line.
- Actions were identified that resulted in savings of **over 350,000 PLN** annually in a single segment.
- Areas to improve efficiency were pinpointed, including:
- inefficient debt financing structure
- excessive number of machines relative to area served
- inflated fuel consumption in selected crops
Cost and Revenue Analysis in Crop Production (historical report)
This dashboard was created as part of a historical analysis of costs and efficiency in crop production at a large farm.
The report aimed to investigate the relationships between inputs (especially fuel consumption), sown area, crop yields, and sales revenues.
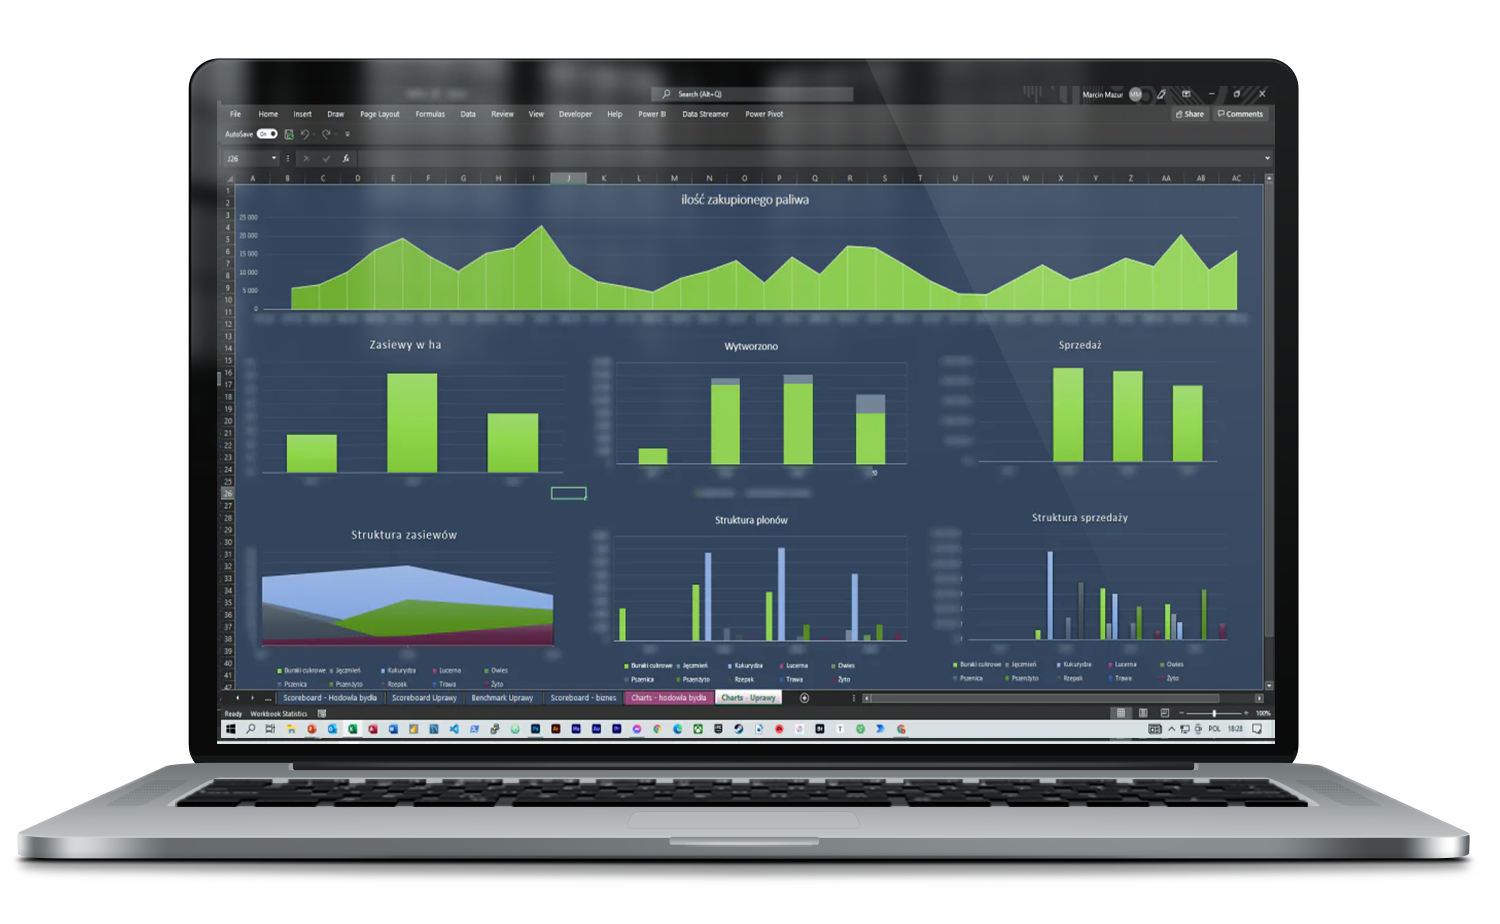
Scope of analysis:
-
Fuel consumption – a chart presenting monthly fuel purchases throughout the analysis period, used to assess the intensity of fieldwork and identify any irregularities,
-
Sowing and harvests – data on cultivated area and actual yields in tons, broken down by key plant species,
-
Sales revenues – a summary of sales value obtained from different crop groups,
-
Structure of sowing, yields, and sales – visual assessment of the proportions between inputs and results for individual crops.
Conclusions from the analysis:
-
Crops with disproportionate costs relative to the achieved economic results were identified,
-
Potential inefficiencies in fuel and area management were disclosed,
-
The analysis became the basis for recommendations on changing the sowing structure and planning fieldwork for the following seasons
Financial analysis dashboard: Crop production – costs, revenues, and profitability
Dashboard created as part of the historical analysis of crop production. Enables assessment of the economic efficiency of individual crops over the full seasonal cycle—including both costs and revenues.
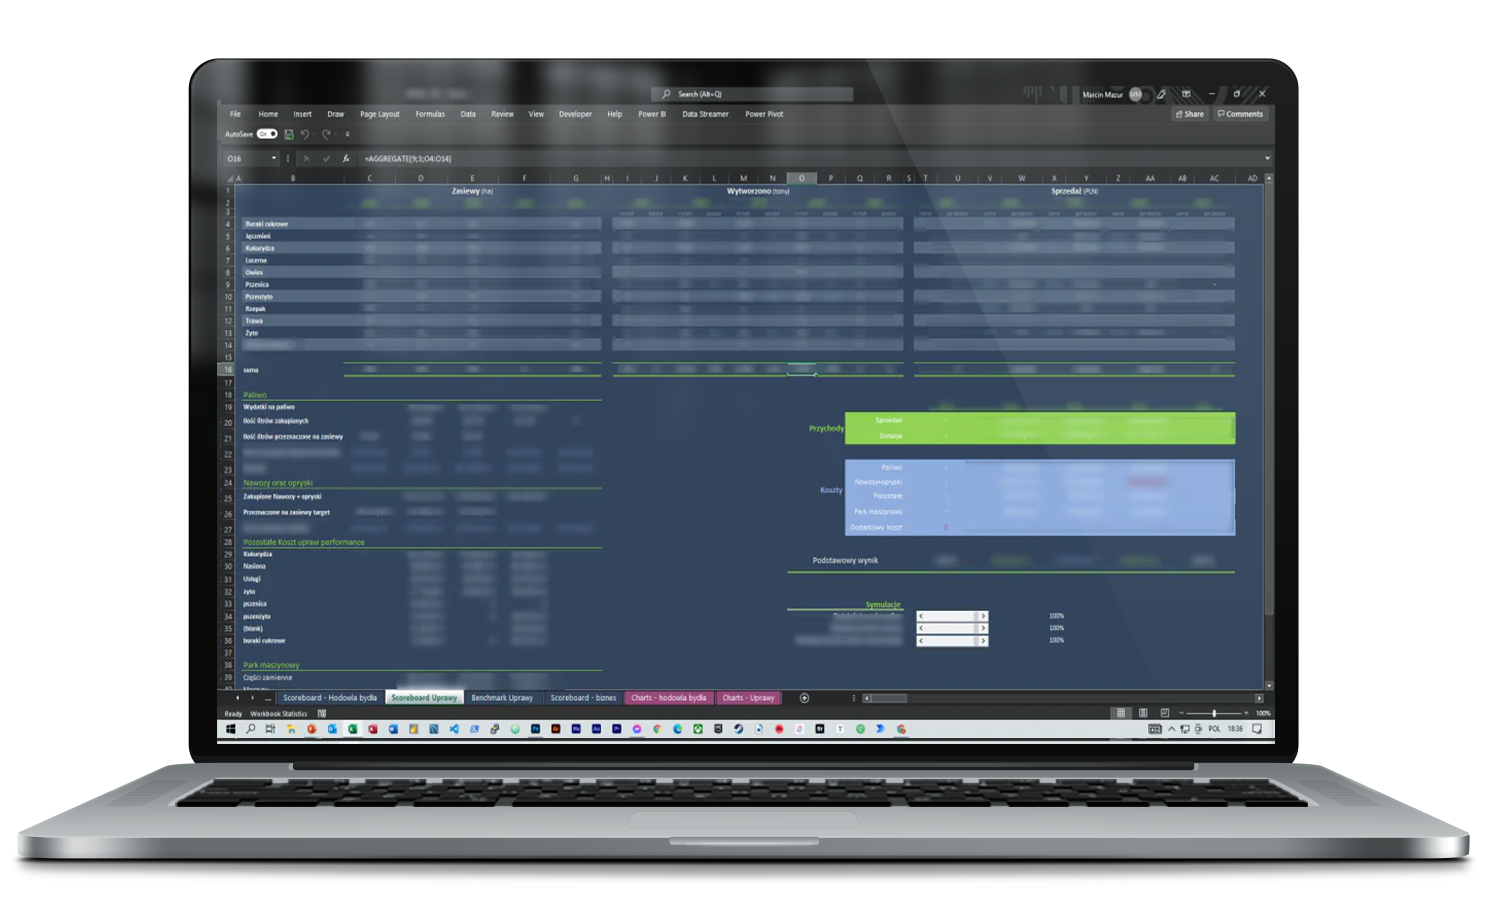
Scope of analysis:
1. Compilation of data on sowing, harvests, and sales for over a dozen crops (including wheat, rapeseed, corn),
2. Cost breakdown into key groups: fuel, fertilizers, plant protection products, machinery fleet, and other variable costs,
3. Automatic calculation of:
- unit and total costs,
- operating margin (per ton and per hectare),
- resource consumption per hectare,
4. Calculation of the main result for total crop operations,
5. Built-in simulations on the impact of changes in purchase prices, costs, and yields on economic performance.
The dashboard was part of a larger report that helped identify crops with too low a margin and excessive technical costs.
Financial analysis dashboard: Milk production – costs, revenues, and result.
This dashboard presents aggregated financial data from milk production, prepared in quarterly breakdown for a one-off analysis of efficiency and cost structure in dairy cattle farming.
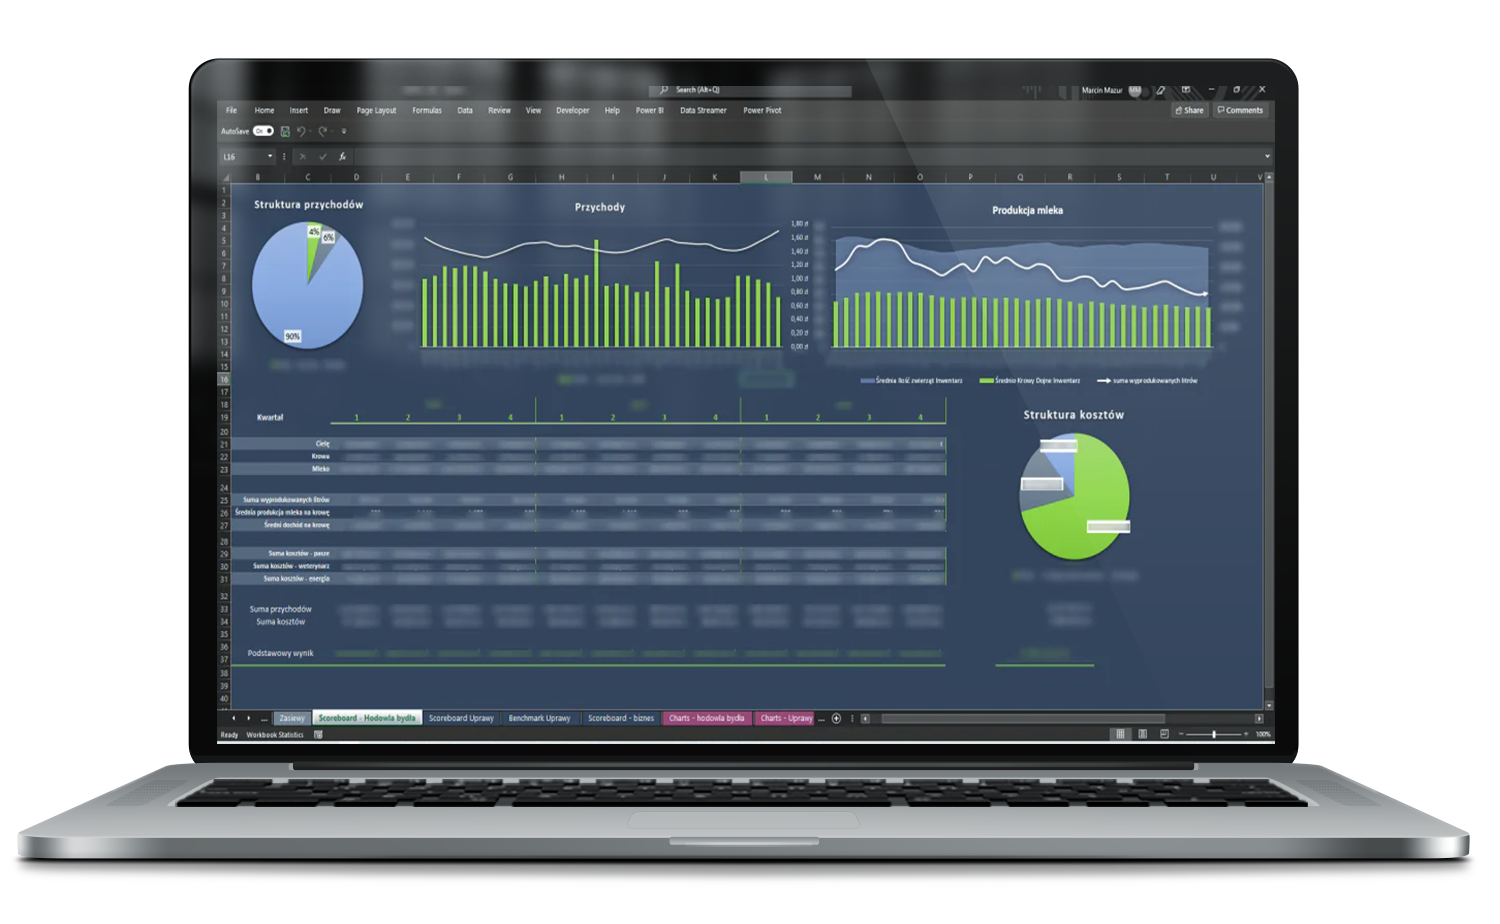
Scope of analysis:
-
Revenue structure divided into milk, livestock, and other sources (pie chart),
-
Milk production revenue shown monthly and quarterly (bar chart with trend line),
-
Milk production: average number of cows, average yield, total milk produced (area chart),
-
Production costs: breakdown into feed, veterinary, energy, and other operating costs,
-
Graphical cost structure (pie chart),
-
Basic result – comparison of revenues and costs on a quarterly basis.
The aim of the analysis was to determine the technical cost of producing a liter of milk and identify potential areas for margin improvement in the context of variable efficiency and herd structure.
From analysis to action
After completing the analysis and identifying key areas for improvement, specific procedures were designed and implemented, supported by dedicated applications. Each tool addressed the detected needs—from fuel cost optimization and TCP control, to data integration between crop and livestock production.
Below are the systems that together created a unified management ecosystem for the entire farm.
Farm Financial Model – the main analytical and management system for the owner and managers, supporting profitability control, liquidity, and development scenarios,
SmartField – a tool for planning, analysis, and control of crop production, including the calculation of the technical cost of production for crops and feed requirements,
OMS (Operational Management System) – a system for recording invoices, costs, and salaries, integrated with management and accounting reporting,
MilkInsights – a module supporting cost and efficiency analysis of milk production, including the impact of herd parameter changes on finances,
LinkField – a tool linking crop production and livestock data, enabling analysis of connections between crop costs, feed, and herd structure,
OilHub – a system monitoring fuel usage and machinery operating costs, broken down by specific field activities and vehicles.
Each tool was implemented along with user training, and the entire set was combined into a consistent ecosystem supporting operational and financial decisions on a farm-wide scale.
This project is a model example of interim CFO work.
From in-depth analysis and diagnosing problems, through designing solutions, to their implementation and handover to the management board.
Thanks to a combination of financial, operational, and technological competencies, robust tools were built that now support the company in making better decisions.