
The real estate market has changed significantly in recent years. Rising construction, energy and financing costs, increased demand volatility, tax regulations, and growing investor expectations mean decisions based on simplified models and averaged assumptions are no longer sufficient.
An accurate understanding of cost structure, revenue sources and time-distributed risks is increasingly critical.
Real estate investment is inherently long-term. It includes not only the construction or acquisition phase but also many years of operation, maintenance, modernization and potential repurposing.
Decisions made at the planning stage — regarding finish standards, leasing profile, financing structure or energy efficiency — have a direct impact on cash flow, profitability and property value over many years.
Therefore, effective real estate investment analysis today requires an approach far more granular than classical “top-down” models. It is essential to combine bottom-up estimating, realistic operating assumptions, market scenarios and sensitivity analysis for all key parameters (energy prices, occupancy, rent rates, financing costs).
Most financial models used in real estate are designed for a one-off assessment of project viability. Their primary goal is to answer: does the project work under a given set of assumptions?
In practice this leads to a simplified top-down approach based on averaged costs, aggregated CAPEX and OPEX items and static operational parameters.
Such models perform well during initial project screening. They become less useful once the property enters real operational life — the period when most of the risks and costs that determine actual returns emerge.
The issue is not a lack of precision in individual numbers, but a lack of structure that enables decision-making through time.
Standard models:
- do not show which physical elements create costs and risks,
- do not connect technical decisions to financial consequences,
- do not allow analysing alternative maintenance, modernization or repurposing paths,
- treat CAPEX as a point event rather than as a process spread across an asset’s life.
As a result, an investor receives a financial result but not a tool for managing the investment.
Artemis was created to fill this gap.
The model was not designed merely to “calculate IRR”, but as a system supporting investment and operational decisions across the entire property lifecycle.
Its key feature is that the starting point is not aggregated costs but the actual fixed assets — broken down into components with assigned function, useful life, replacement schedule and financial implications.
This makes it possible to model the property not as an abstract financial asset but as a set of technical elements that age, require expenditures, generate costs and affect revenues and value over time.
Artemis integrates in a single model:
- bottom-up estimating at component level,
- schedules for repairs, replacements and modernizations,
- ongoing maintenance and service costs,
- the impact of technical decisions on cash flow, depreciation and taxes,
- and the long-term residual value of the property.
This approach allows asking questions standard models cannot handle, such as:
- does delaying replacement of a given element truly improve cash flow or merely postpone the cost at the expense of asset value,
- at what point does modernization stop adding economic value and become purely a cost,
- how does a change in technical standard affect long-term OPEX, not just CAPEX,
- does a planned redevelopment or change of function make financial sense across the whole investment horizon, not only in the initial years after completion.
Artemis’ key difference is that operational decisions are not “tacked onto” the financial model — they are an integral part of it.
Every decision regarding standard, scope of work, timing or financing source has a direct and measurable impact on cash flows, financial results and property value.
As a result, the model stops being a one-off analytical tool and becomes a platform for conscious asset management over time.
Artemis enables not only entry-stage profitability assessment but, above all, the reduction of decision errors that remain invisible in classical models.
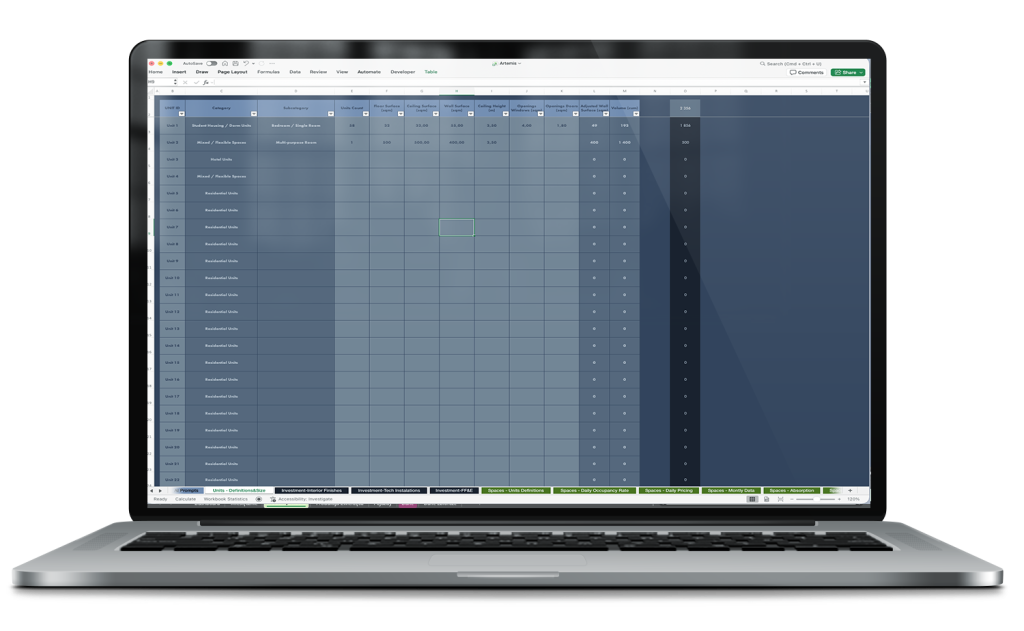
Units Module – Spatial Structure of the Property
The Units module is the foundation of the Artemis model because it defines all spatial volumes and their components for both existing and planned buildings. This makes every element of the property measurable and analyzable in terms of costs, area, volume and potential revenues.
Key functions of the module:
1. Unit and space definition
Each Unit is defined as a distinct geometric volume with an assigned category and subcategory (e.g. “Student Housing / Dorm Units” → “Bedroom / Single Room” or “Mixed / Flexible Spaces” → “Multi-purpose Room”).
This allows precise representation of existing building structure and design of new units in future projects.
2. Physical and geometric parameters:
- Floor Surface (sqm) – unit floor area.
- Ceiling Surface (sqm) and Ceiling Height (m) – ceiling area and height, important for volume and material cost calculations.
- Wall Surface (sqm) and Adjusted Wall Surface (sqm) – wall area adjusted for window and door openings.
- Volume (cum) – unit volume for accurate material and energy calculations.
3. Openings analysis
The module accounts for window and door openings, enabling precise calculation of material requirements and finishing costs.
4. Aggregation across the property:
- The module allows counting units, total usable area and volume for the entire building or complex.
- These are foundational inputs for downstream modules: estimating, CAPEX, OPEX, leasing analysis and modernization planning.
Why the Units module is key
The Units module enables Artemis to:
- link spatial geometry with finance – every square meter or m³ maps to CAPEX, OPEX and revenues.
- model change-of-use scenarios – easily add or modify units in existing buildings or planned projects.
- accurately calculate the asset lifecycle – from materials and finishes through maintenance to modernization and repurposing.
As a result, the investor receives not just a number in a spreadsheet but a full spatial map of the property that can be quantitatively analysed and tied to financial decisions.
CAPEX in Artemis – Classification and Structure
In Artemis each capital expenditure is assigned to a dedicated CAPEX category according to its nature and the calculation method. This classification is the foundation for all CAPEX modules, both for new constructions and for modernization of existing properties.
1. Expenditure categorization
- Real Estate – building types: office, industrial, residential, hotel, student housing, parking, roads.
- Building Envelope – façades, windows, doors, roofs, insulation and structural repairs.
- Interior Finishes – interior finishes, floors, ceilings, walls, doors.
- Technical Installations – HVAC, ventilation, pumps, boilers, electrical installations, BMS, UPS, security systems.
- FF&E – furniture and equipment for rooms, common areas and specialized fittings.
- Intangible Assets – patents, licences, software and copyrights.
- Office Equipment – office appliances and IT equipment.
- Transportation & Vehicles – cars, trucks and other vehicles.
- Financial Instruments – shares, bonds, investment funds.
- Residential Units – specific unit types for residential, hotel and office uses.
2. Dedicated modules for each category
Each CAPEX category has its own module that reflects the specifics of calculation, scheduling and cost classification.
Example: valuation and scheduling of FF&E differ from Interior Finishes – furniture and equipment are treated differently than finishing works with respect to wear, depreciation and operating costs.
3. Applicability across investment types
This terminology and classification enable a consistent approach to CAPEX for both new projects and refurbishments.
As a result, Artemis can aggregate data across an entire property or a portfolio regardless of the nature of expenditure.
4. Integration with other modules
All CAPEX modules are interconnected with each other and with other parts of the model, allowing assignment of expenditures to specific spaces or building components.
Universal logic of CAPEX modules in Artemis
All CAPEX modules in Artemis — regardless of expenditure category — follow the same logic for processing, scheduling and integrating operational data with finance:
1. Link to Units
Each CAPEX expenditure is assigned to a specific unit, volume or component.
This enables:
- precise cost tracking for a single room, floor or common area,
- aggregation of expenditures across the entire property or portfolio,
- data consistency when planning new units or refurbishing existing ones.
2. Capitalization and phased scheduling
Expenditures are split into investment stages (Initial, Extended, FAR), and the model calculates:
- EFAR Value and EFAR Date for each element,
- which costs can be capitalized and which must be recorded as current expenses,
- investment scheduling in Wide mode (groups of units, floors) or Long mode (individual units, exact dates and stages).
3. Granularity and cost control
Each CAPEX item has assigned:
- Unit Cost Net and VAT Rate,
- EFAR Count and EFAR Value,
- Useful Life for planning replacement or servicing.
This allows monitoring expenditures across the asset lifecycle and controlling the impact on the balance sheet, depreciation and OPEX.
4. CAPEX ↔ OPEX integration
Expenditures on technical equipment, furniture, installations and appliances are automatically linked to OpexFromCAPEX modules that calculate:
- energy and utilities consumption,
- service and maintenance costs,
- operating costs across the asset lifecycle.
As a result, CAPEX is immediately reflected in future cash flows and operating costs.
5. Dedicated modules per CAPEX category
Each category (Building Envelope, Interior Finishes, Technical Installations, FF&E etc.) has its own module that applies the above logic while adapting calculation and scheduling methods to the nature of the expenditure.
This allows the investor to precisely plan costs, schedule, capitalization and the impact on OPEX for each expenditure type without repeating universal rules.
6. Verification of data freshness and completeness using AI
Thanks to integration with OpenAI GPT and Grok, each CAPEX item is automatically checked for current market prices, component availability and correct assignment to units and CAPEX categories. The system analyses large volumes of data — from hundreds of equipment and material items to diverse building units — and signals potential inconsistencies, missing information or outdated prices in real time.
Such automatic verification significantly reduces the risk of planning errors. Practically, it means the investor does not need to manually check every item, compare price lists or search for component availability. The system does that and, thanks to AI, can also suggest alternatives and updates based on the latest market data.

The benefits of this approach are multidimensional. First, it ensures that the planned budget is based on current and complete data. Second, it enables quick reaction to price changes or component shortages, which is invaluable in large projects with hundreds or thousands of CAPEX and FF&E items. Third, using AI to process these data frees up time for financial and project teams, allowing them to focus on strategic decisions and scenario analysis rather than manual price comparison.
As a result, integrating CAPEX with AI not only increases the accuracy of calculations and schedules but also makes the entire investment management process more flexible, predictable and resilient to market changes. For large property portfolios and multi-stage projects this is an invaluable competitive advantage.
CAPEX Module – Investment Interior Finishes
The Interior Finishes module enables precise planning, scheduling and capitalization of finishing expenditures in property units, fully linked to the Units module.
Key features of the module:
1. Automatic assignment and cost calculation
Each finishing element (paint, flooring, doors, panels) is automatically assigned to a unit with cost type, calculation method, VAT and area share.
2. Capitalization and scheduling
The module calculates capitalization of costs across investment stages (EFAR Value/Date) and distinguishes capitalizable expenditures from current expenses, enabling control over balance sheet impact and depreciation.
3. Wide and Long planning
Investment planning can be performed in Wide mode (groups of units, floors) or Long mode (detailed per unit with exact dates and stages).
4. Granularity and control
The module allows tracking both standard and specialized finishing elements regarding cost, applied area and impact on margins.
5. AI verification
Each element can be automatically verified for up-to-date pricing and availability, improving planning and scheduling accuracy.
CAPEX Module – Investment Technical Installations
The Investment Technical Installations module in Artemis enables planning, scheduling and capitalization of technical expenditures covering HVAC, electrical, IT, sanitary and mechanical installations.
Key features of the module:
1. Automatic linking to Units
Each device is assigned to the appropriate unit or common area. The system considers quantity, area and location to accurately calculate costs and assign them to the correct parts of the property.
2. AI verifying costs and data completeness
After entering equipment budgets, quantities and locations, AI analyses:
- market price freshness for each component,
- quantity consistency with the planned space,
- correctness of assignment to Units and CAPEX categories,
- potential conflicts or gaps in planning (e.g. too few air conditioners for office area).
4. Granularity and cost control
Each element has assigned: Unit Cost, VAT, EFAR Value and Useful Life. The system aggregates these data at unit, floor or whole-building level, enabling tracking of expenditures and planning of modernizations over time.
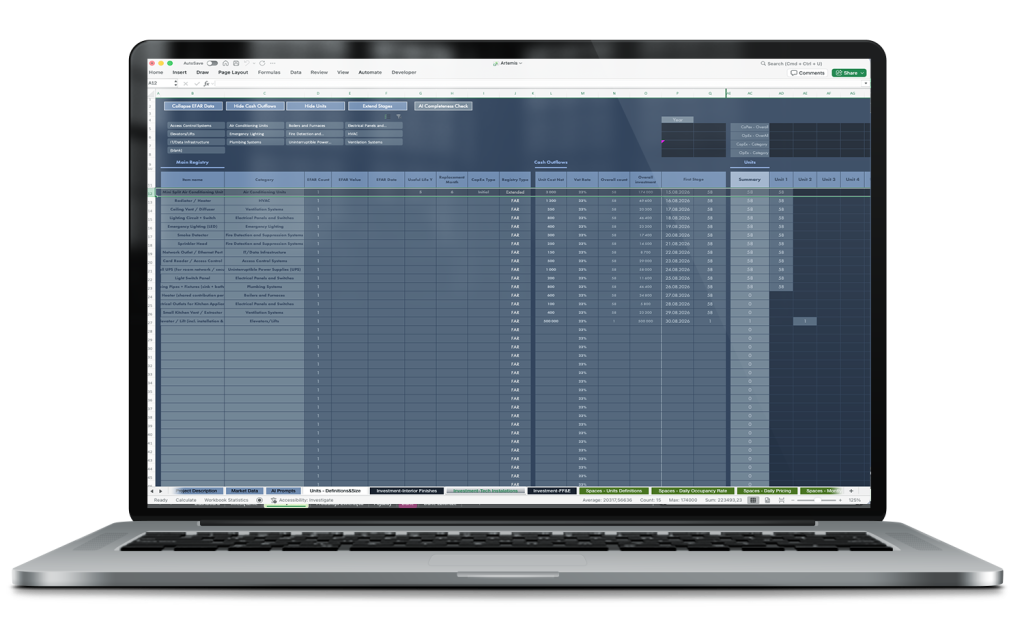
Why the module is key
Thanks to AI integration, the module not only calculates technical expenditures but also automatically verifies their correctness, suggests alternative components, forecasts operating costs and helps avoid common planning mistakes.
The investor receives a tool that combines technical precision with real financial consequences, not just a “shopping list”, which in large multi-stage projects provides decision-making advantage and reduces cost risk.
CAPEX Module – Investment FF&E (Furniture, Fixtures & Equipment)
The FF&E module in Artemis is used for precise planning of equipment expenditures in properties, covering furniture, electronics, kitchen and bathroom fittings and mobile devices. Unlike interior finishes or technical installations, FF&E costs relate to movable or easily replaceable items rather than the building’s fixed structure.
Key features of the module
Precise assignment to units
- Each FF&E item (bed, wardrobe, desk, TV, fridge, lighting, curtains) is assigned to the appropriate unit – room, apartment or common area.
- The module controls quantities per area or number of user places, ensuring data consistency for further analysis and reporting.
Capitalization and investment scheduling
- For each item EFAR Value and EFAR Date are calculated as well as the posting moment into the books.
- The system distinguishes capitalized costs from those that are not capitalized, allowing tracking of the equipment’s impact on the balance sheet and depreciation.
Staged planning of expenditures
FF&E expenditures can be scheduled in stages, for example:
- basic furnishing of rooms, bathrooms and common areas,
- additional items, upgrades, equipment replacements.
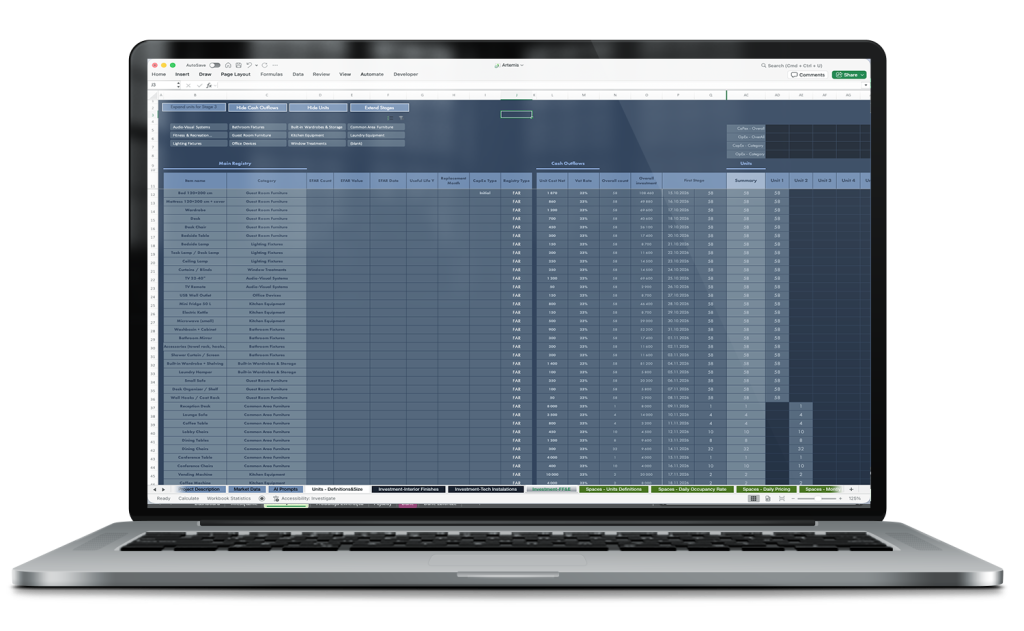
4. Granularity and control
CAPEX modules in Artemis provide complete, detailed records of expenditures for each unit, component or common area. This gives the investor and financial team full awareness of:
- What is planned to be purchased,
- Where the item will be used – precisely assigned to a room, apartment, floor or common area,
- How many units or area the expenditure covers, its cost and timing.
As a result, the system creates a very precise inventory of all expenditures, allowing full control over the budget and investment plan across the project lifecycle.
Additionally, integration with OpenAI and Grok (AI) enables automatic data verification and report generation:
- checks for correct assignments, missing items, outdated prices and data inconsistencies,
- AI analyses hundreds of items in minutes—work that would normally take an analyst hours,
- the automatically generated report allows the team to react faster to issues and make decisions about budget or schedule adjustments.
Effect: full control over expenditures, time savings for analysts and quick identification of potential problems in the investment.
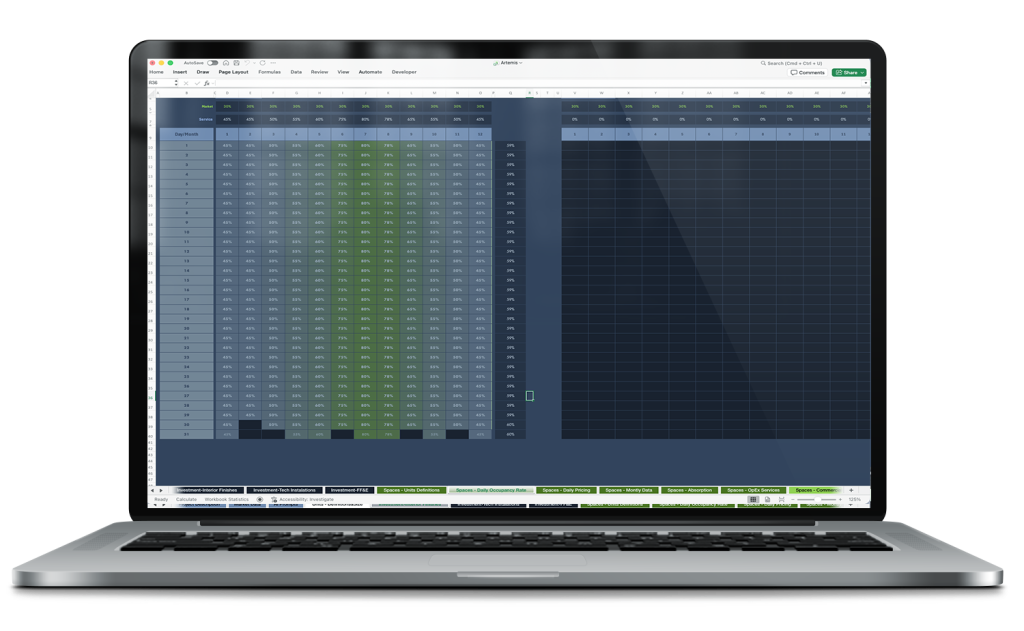
Commercialization Module (Spaces – Commercialization)
The module defines how each Space (commercializable area) generates revenue. For each Space a commercial profile, seasonality, start date, price version, operating costs and financial forecasts for subsequent years are assigned.
Price and occupancy/ADR/RevPAR data are based on market benchmarks from the Themis system. The model allows immediate comparison of 5–8 commercialization variants for the same property or its part — without changing the model structure.
Main elements defined in the Space Commercialization module
Service Type – service / commercial profile:
- STR(D) – Short-Term Rental (daily)
- Hotel(D) – hotel / aparthotel (daily)
- Monthly(M) – long-term rental (monthly)
- Build To Sell(A) – sale of apartments (one-off)
Seasonality Type – seasonality:
- STR/Hotel: daily seasonality (e.g. high season May–September, low season January–March)
- Monthly: monthly seasonality (e.g. higher rents in Q4, lower in Q1)
- BTS: constant or phased (velocity of sales depending on investment stage)
Availability From:
commercialization start date for the Space
Counts:
number of units / Spaces in the given profile
Pricing:
price version (from Themis: benchmark ADR/rent per sqm, growth dynamics)
Service OpEx:
operating costs assigned to the service (cleaning, utilities, security, OTA commissions, taxes)
Financial forecasts:
revenues, OpEx, margin for subsequent years, automatically calculated according to seasonality and benchmarks
Model operation
- Assign profile and seasonality to each Space.
- Automatically calculate daily/monthly revenues based on occupancy and ADR from Themis benchmarks.
- Allocate OpEx Service costs according to profile and unit counts.
- Instant comparison of variants (STR vs. Hotel vs. Monthly vs. BTS) within the same building or floor.
- “What-if” analyses: change seasonality, prices, occupancy, add PV → immediate impact on revenue forecasts, margin and NOI.
Benefits for the investor
Fast simulation of 4–6 commercialization variants in <30 min. Realistic pricing and occupancy data based on Themis benchmarks. Compare variants without changing model structure. Support strategic decisions: “hold and rent” vs. “sell” vs. “change profile in the future”. Full record of revenues and operating costs for each Space – precise control and reporting.
Seasonality and STR Pricing Module in the Artemis financial model
Responsible for defining seasonality (occupancy rate) and average rental prices (pricing) for the short-term rental market (STR – Short Term Rental). Data used in the module come from the Themis system, which collects reliable market data and presents it in a simple format for financial analysis.
Key functionalities of the module:
1. Defining seasonality (Occupancy Rate)
- The module allows specifying average monthly occupancy for the whole market and for a specific service or property type (Service).
- Occupancy can be defined in multiple seasonality variants (e.g. Seasonality 1 and Seasonality 2) for different business scenarios.
- Each property and space type can have its own dedicated seasonality, which is critical for STR, Hotel Build-To-Sell or long-term rental models.
This enables capturing differences in seasonal demand depending on location and business model.
2. Defining average pricing (Average Price)
The module allows entering average rental prices for the whole market and for specific service types.
It supports multiple scenarios (Pricing 1, Pricing 2) and their adjustments (Pricing 1 Corrections, Pricing 2 Corrections), enabling simulation of the impact of price changes on revenues.
Prices can be provided as percentage variants relative to the base value to quickly test market scenarios and their effect on cash flow.
3. Scenario and comparative analysis
The module allows comparison of different seasonality and pricing scenarios in relation to planned CAPEX or other investment expenditures.
This makes it possible to assess which variants are more profitable, e.g. whether investing in additional CAPEX to increase peak-season revenues is worthwhile.
Data can be presented both annually and daily, enabling detailed analysis of seasonality impact on revenues in both short and long term.
Module: OpEx – Hotel / STR Services
The OpEx – Hotel / STR Services module enables detailed modelling of operating costs associated with day-to-day operation and service delivery in hotel, apartment (STR) and mixed commercial profiles.
The starting point is a central service library where each item is defined with full parameter specification, ensuring data consistency and eliminating manual copy errors.
Structure of service definitions in the OpEx Services module
Each service / cost item has the following key attributes:
OpEx ID / Service Name –
unique service name (e.g. “ozonite room”, “daily cleaning”, “internet”, “laundry”, “reception shift”, “OTA commission”)
Type – settlement type and frequency:
- One Time Payment – one-off fixed payment
- One Time Payment – Per Service – one-off payment per execution / use
- Monthly – recurring monthly payment
Cost Net – net cost of the service (in PLN)
VAT Rate – VAT rate
OpEx Version – version / scenario number in which the service is active
This mechanism makes it possible to create many consistent service packages corresponding to different operational standards (e.g. Version 1 – full daily hotel service, Version 5 – limited monthly service, Version 10 – hybrid mix with selective cleaning).
Module value-add
Thanks to integration of OpEx Services with other modules (Units, Commercialization, Seasonality, Themis benchmarks) Artemis turns static operating assumptions into a dynamic element of asset lifecycle analysis.
The investor receives not only a financial result but a tool for consciously choosing the operational profile, optimising service costs and testing “what-if” scenarios in real time — with full transparency of impact on cash flow, profitability and the long-term value of the property.
Integration with the Commercialization module (Spaces – Commercialization)
In the Commercialization module, services defined in OpEx Services are assigned directly to specific spaces / groups of units (Units / Spaces) and to a selected commercial profile:
- STR(D) – Short-Term Rental (daily)
- Hotel(D) – hotel profile (daily)
- Monthly(M) – long-term monthly rental
- Mixed – hybrid profiles (e.g. 60% STR + 40% Monthly)
Assignment is done at the level of floor, room group or individual unit, with automatic allocation of costs proportional to area, number of places or usage intensity.
The model automatically calculates:
- total OpEx Services costs (including VAT) at unit, floor and whole-building level
- direct impact on contributory margin (revenue minus direct service costs)
- net operating income (NOI) after all operating costs are included
- Comparing variants in one view
Artemis allows up to 20 OpEx Services versions to be compared in a single table/dashboard. The investor sees the immediate effect of changing a service package on:
- gross and net revenues (RevPAR, ADR, Gross Revenue – based on Themis benchmarks)
- operating service costs (sum of OpEx Services after allocation)
- contributory margin and NOI at building level
- cumulative cash flows and residual value over a horizon of up to 25 years
This mechanism works similarly for the Seasonality module – different occupancy and ADR curves (Seasonality A/B/C) can be combined with different OpEx Services versions, enabling rapid assessment of the profitability of different operational strategies (e.g. aggressive STR with high service vs. stable monthly with minimal OPEX) without building separate models.
Value-add of the module
By integrating OpEx Services with other modules (Units, Commercialization, Seasonality, Themis benchmarks) Artemis transforms static operating assumptions into a dynamic element of asset lifecycle analysis. The investor receives not only a financial result but a tool for conscious choice of operational profile, optimisation of service costs and testing “what-if” scenarios in real time — with full transparency of impact on cash flow, profitability and the long-term value of the property.
The Artemis financial model includes, among others, the following modules enabling comprehensive financial analysis of real estate projects for STR, long-term rental and Build-to-Sell strategies.
Each module allows precise data management, revenue and cost forecasting, and scenario comparison:
- Market Data – basic market data, rental rates, occupancy and ADR benchmarks.
- AI Prompts – automation for generating scenarios and forecast analyses.
- Units – Definitions & Size – unit parameters: area, volume, number of rooms.
- Spaces – Units Definitions / Daily Occupancy Rate / Daily Pricing / Monthly Data / Absorption / OpEx Services / Commercialization – modules covering all spatial and revenue aspects of units, including seasonality, pricing, occupancy and operating costs.
- Finance Core – central module for capital raising, shareholder loans and other financing sources.
- Bank Loans – loan schedules, instalments and interest.
- Leasings – calculation of optimal leasing form, repayment period and total costs.
- Salaries – personnel costs and employee benefits.
- EFAR – CapEx / Depreciation – capital expenditure planning and asset depreciation.
- OFC – Electric Energy / Fuel / Service Costs / Spare Parts – detailed operating costs including energy, fuel, service and spare parts.
- Renewable Energy Sources – RES production and its impact on costs.
- OpEx / OpEx Data / OpEx – VAT Data – detailed operating expenditures and VAT data.
- TAXES / Economic Trends – tax calculations and macroeconomic indicators.
- Financial Dashboard / RA – Margin & Profits / Benchmark – performance analysis, margins and comparison with market benchmarks.
- Incomes / Financial Statement – revenues, P&L, balance sheet and cash flow.
- DCF–NPV–IRR–BV–ABV – dynamic project valuations and profitability analysis.
- Financial Data M / Y / Financial Liabilities Data / EFAR – Balance Sheet Values Data – monthly and yearly reports, liabilities and balance sheet values.