Creating an advanced financial and operational model for planning, budgeting, and securing funding for a technology project in the automotive sector.
The financial model was created in 2014.
Project Objective:
Development of a Proof of Concept for an innovative mobile application connected to a car’s onboard computer, enabling:
- Vehicle error analysis (computer diagnostics),
- Maintaining a digital log of vehicle usage,
- Guidance and optimization of driving style in the spirit of eco-driving.
The financial model covered all aspects of product development, preparing the project for discussions with investors, including the KFK (National Capital Fund).
Technological and Financial Assumptions
- An application based on cloud solutions, with dynamic simulation of AWS (Amazon Web Services) service costs.
- Detailed modeling of software development and operational costs as the project scales.
- Revenue forecasting based on various monetization models: fees, subscriptions, service charges.
- Building a financial model resilient to market changes thanks to embedded scenario analysis.
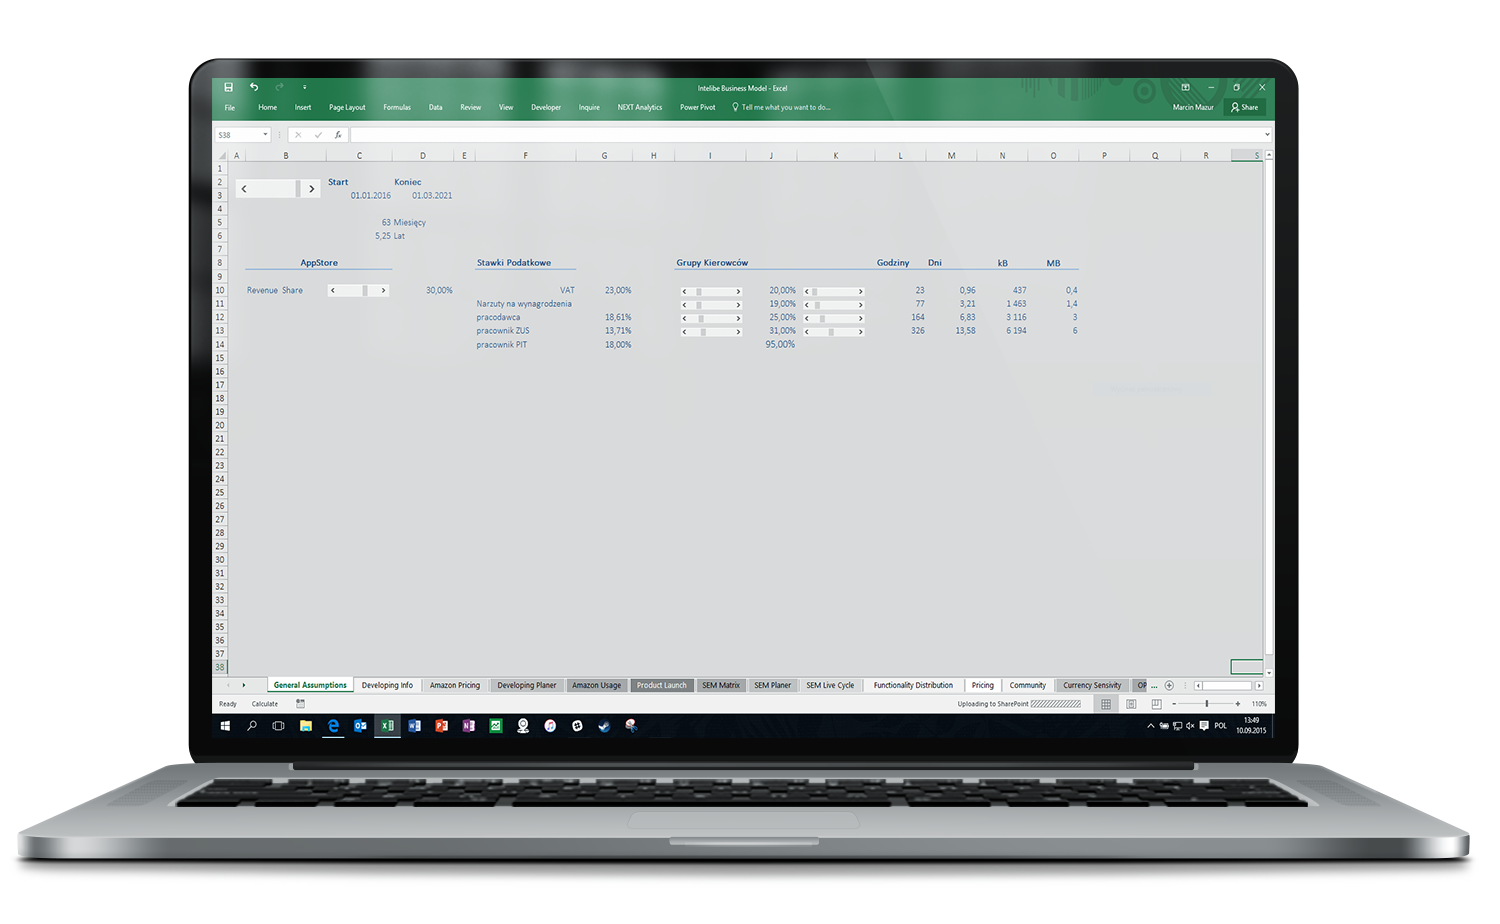
General Parameters – Model Configuration and Assumptions
The model enabled dynamic definition of key project parameters:
- number of users,
- unit revenues,
- unit costs,
- growth rate.
This allowed the entire financial model to be adjusted to changing market and strategic assumptions.
Modeling AWS (Amazon Web Services) Cloud Costs
Detailed mapping of cloud service costs based on current price lists.
Inclusion of various infrastructure usage options:
- standard instances (On-Demand),
- reserved instances at low, medium, and high usage (Reserved Instances – Light, Medium, Heavy),
- separate calculations for the EU and US regions, taking price differences into account,
- modeling of data storage (Storage) and data transfer costs (Monthly Transfer Pricing),
- simulation of costs depending on the number of users and application scale.
Project Significance:
Thanks to this module, it was possible to:
- realistically estimate infrastructure costs in every development scenario,
- build precise operational budgets,
- eliminate the risk of underestimating server, data storage, and data transmission expenses,
- increase the financial model’s credibility in the eyes of investors.
Simulation of Exchange Rate Fluctuations and Currency Sensitivity Analysis
Analysis of the impact of exchange rate changes on project results.
The “Currency Sensitivity” module in the Intelibe model enabled:
- Accounting for the impact of changes in EUR, USD, and PLN exchange rates on the project’s revenues and operating costs.
- Entry of both actual and simulated exchange rates for the entire forecast period.
- Dynamic scenario analysis of exchange rate changes quarterly, based on historical data and own assumptions.
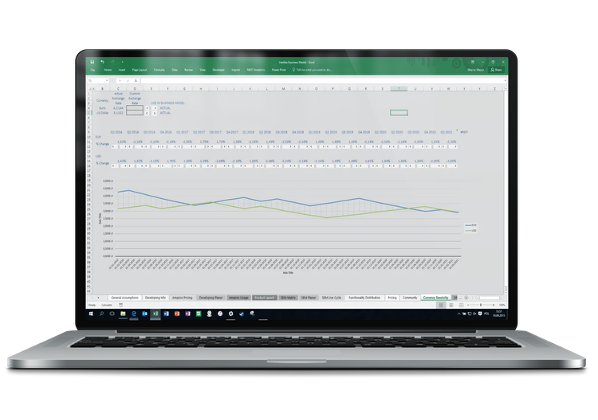
The project was global in nature—some revenues and costs were to be generated in EUR and USD, while expenses were simultaneously incurred in PLN.
Thanks to this module, it was possible to:
- determine how sensitive the project’s financial result is to changes in exchange rates,
- prepare for currency risk already at the planning stage,
- build more resilient financial scenarios.
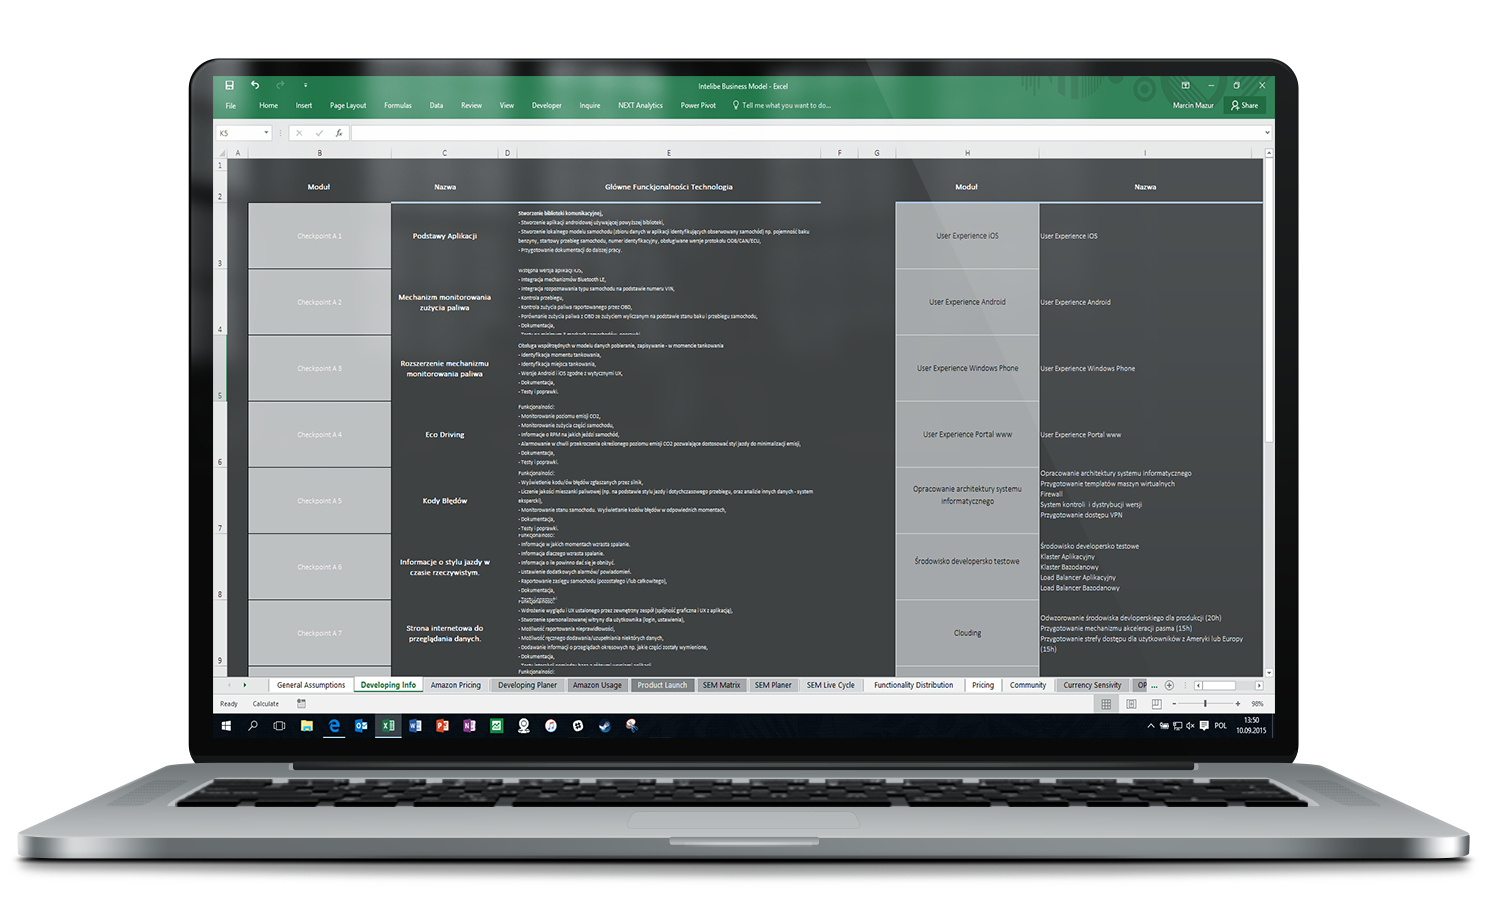
DEVELOPMENT INFO – System Features and Architecture
The “Development Info” module in the Intelibe financial model included, among others:
- A detailed list of planned application features, divided into modules (including eco-driving analysis, fuel consumption monitoring, OBD error diagnostics, user portal).
- Assignment of main tasks to individual project development stages (“Checkpoints”), along with specification of technological requirements.
- Consideration of requirements for various operating systems (iOS, Android, Windows Phone) and the web portal.
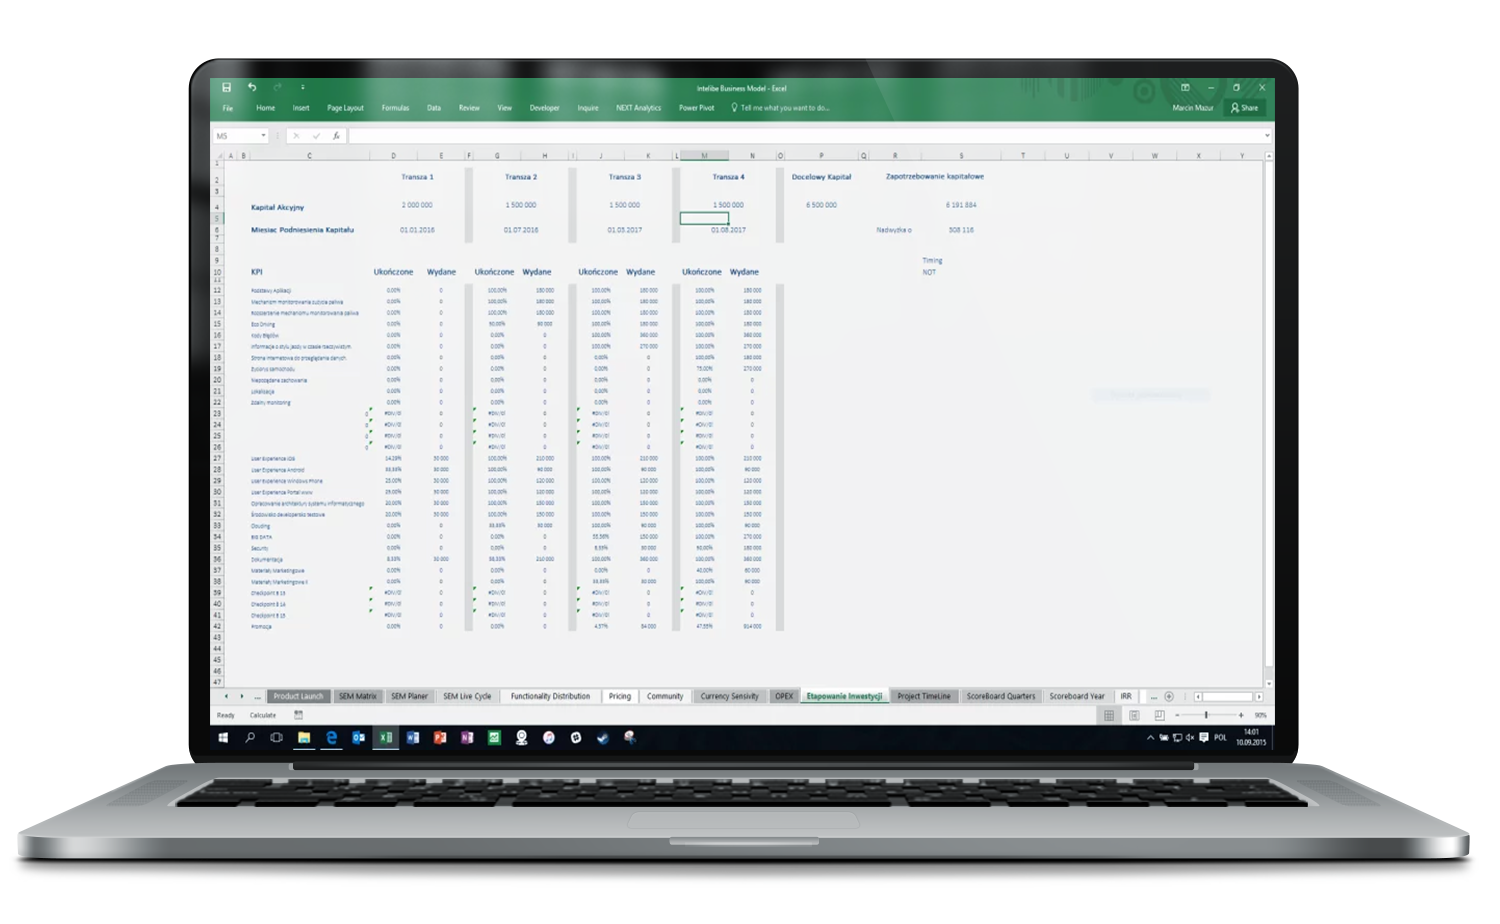
KPI and Control of Investment Stages
Project management and KPIs – effective development planning.
The financial model for the Intelibe project integrated project planning and KPIs, supporting:
- control over the effectiveness of operational activities,
- analysis of the degree of completion of key projects,
- effective management of resources and budget.
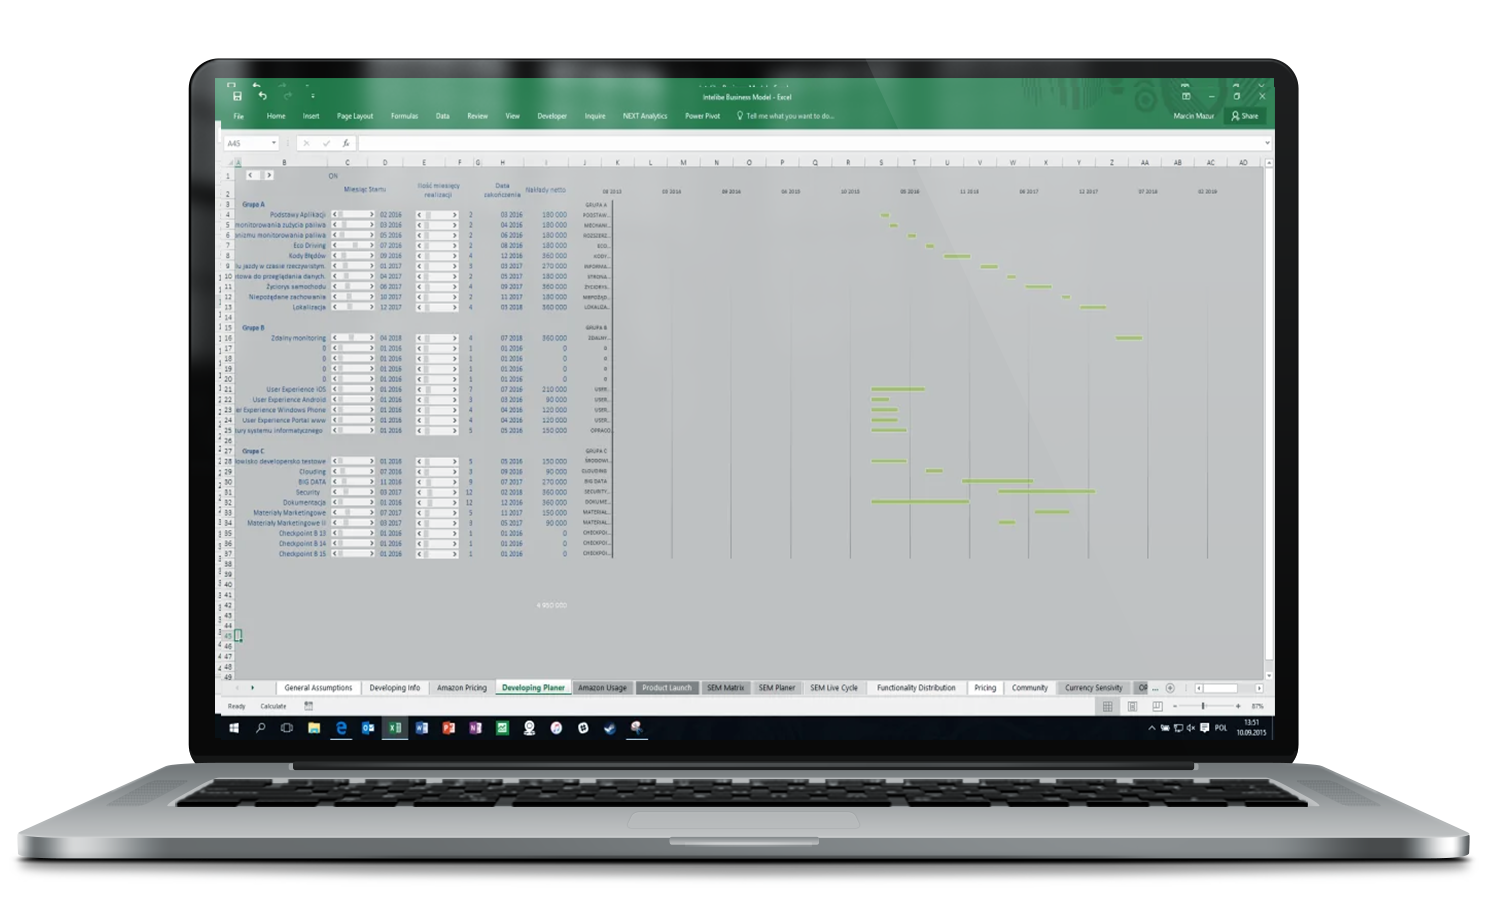
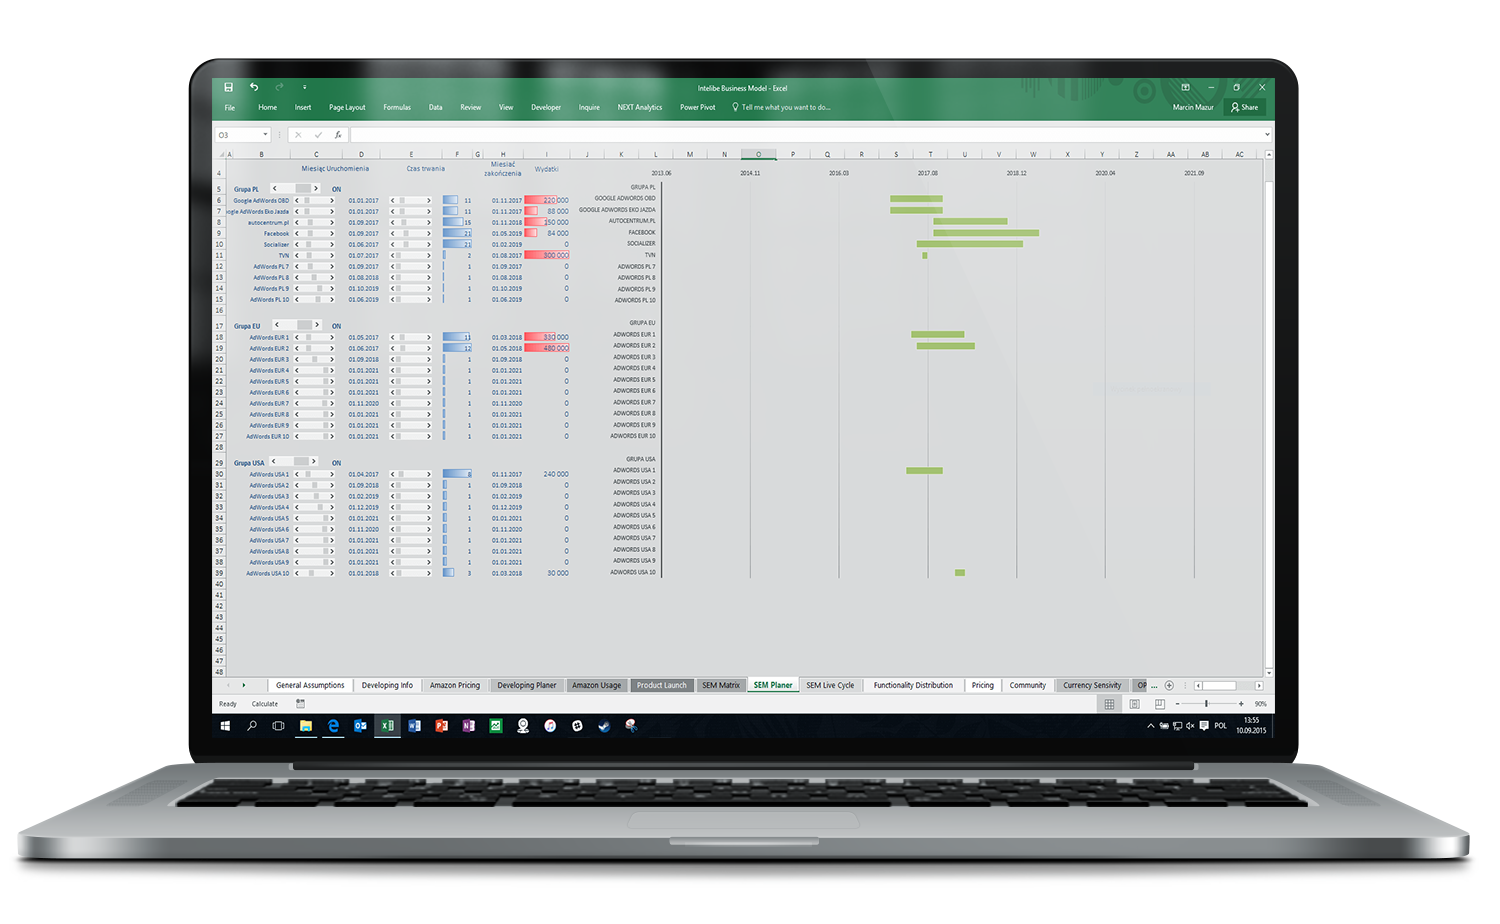
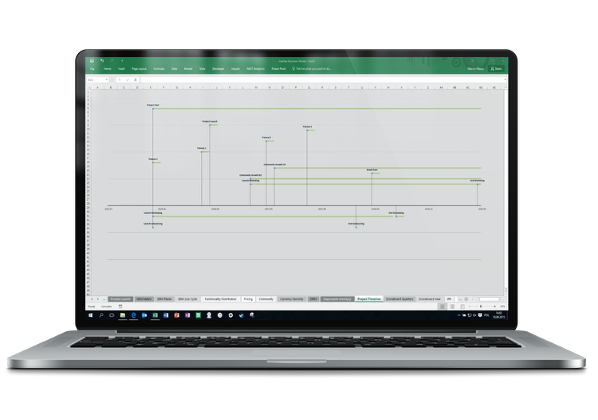
PLANNING OF DEVELOPMENT WORK
Development work schedule – project execution control.
Built-in Gantt schedule for development tasks:
- enabled planning and control of key application development stages,
- helped manage the project budget,
- minimized the risk of delays and cost overruns.
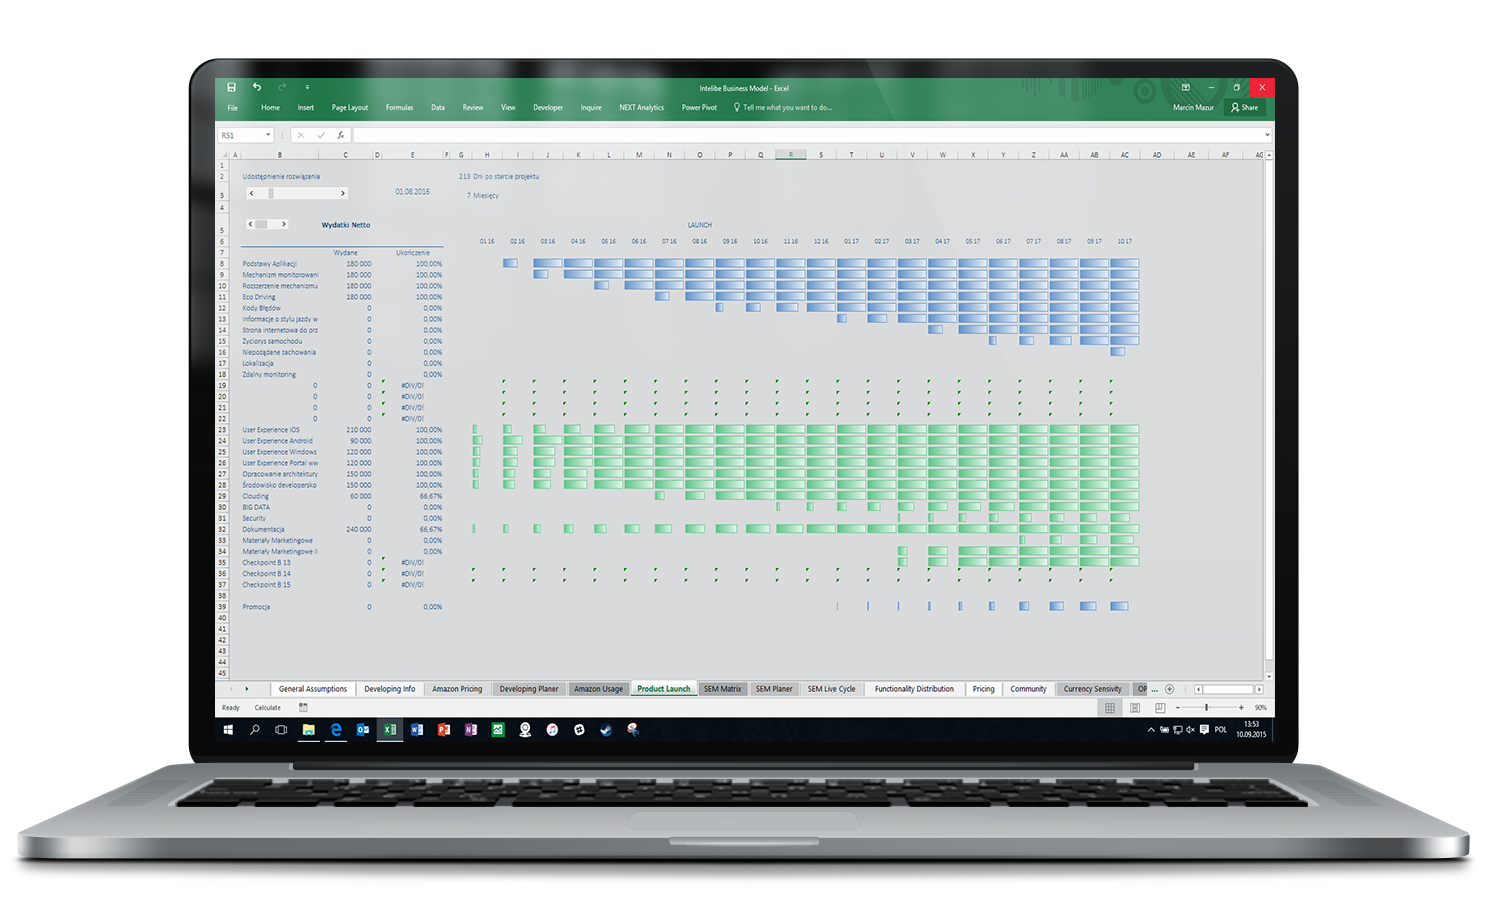
VISUALIZATION OF EXPENDITURES ON SOFTWARE DEVELOPMENT
Visualization of capital investment in technology development
The model included a detailed analysis of:
- the breakdown of expenditures for each stage of software development,
- monitoring R&D budget utilization,
- optimizing investments in terms of the application’s functional objectives.
MARKETING CAMPAIGN PLANNING
Planning marketing campaigns – supporting user growth:
The model included:
- a schedule for marketing campaigns,
- budgeting for promotional activities,
- analysis of marketing expenditures’ effectiveness in relation to user acquisition and revenue
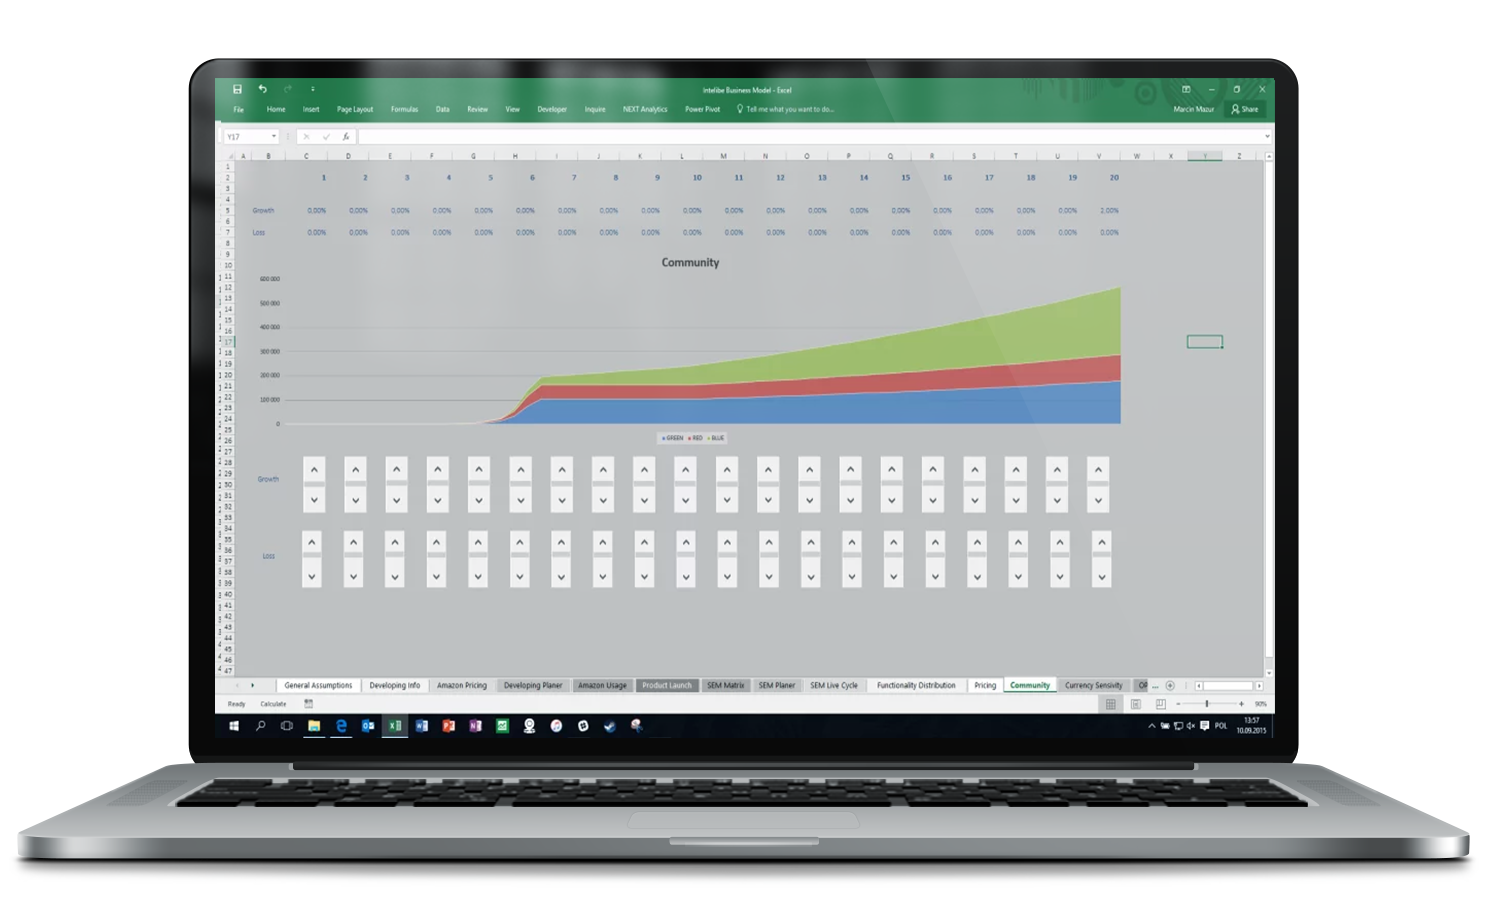
MODELING THE SHARE OF PRODUCTS/SERVICES
Dynamic modeling of service popularity and impact on financial results
Thanks to this module, it was possible to:
- realistically reflect customer behavior and market dynamics,
- forecast changes in revenue structure depending on the development strategy of the offering,
- prepare a financial model resilient to changes in user preferences,
- increase the project’s value in the eyes of investors by adopting a flexible approach to revenue planning.

The “Functionality Distribution” module in the Intelibe financial model enabled:
- Dynamic simulation of the percentage share of individual services or packages (e.g., basic version, premium, subscriptions) in the total user base.
- Defining scenarios for the increase or decrease in the popularity of specific offers over time.
- Analysis of the impact of changes in user structure on the project’s revenues and profitability.
- Rapid testing of different marketing and pricing strategies to maximize revenues.
The “Functionality Distribution” module in the Intelibe model enabled:
- Dynamic simulation of the percentage share of individual services or packages (e.g., basic version, premium, subscriptions) in the total user base.
- Defining scenarios for the increase or decrease in the popularity of specific offers over time.
- Analysis of the impact of changes in user structure on the project’s revenues and profitability.
- Rapid testing of various marketing and pricing strategies to maximize revenues.
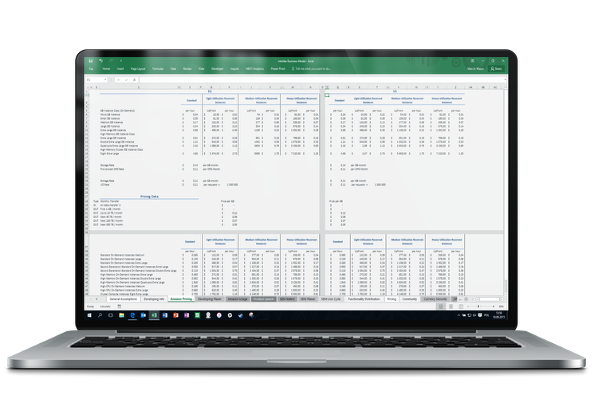
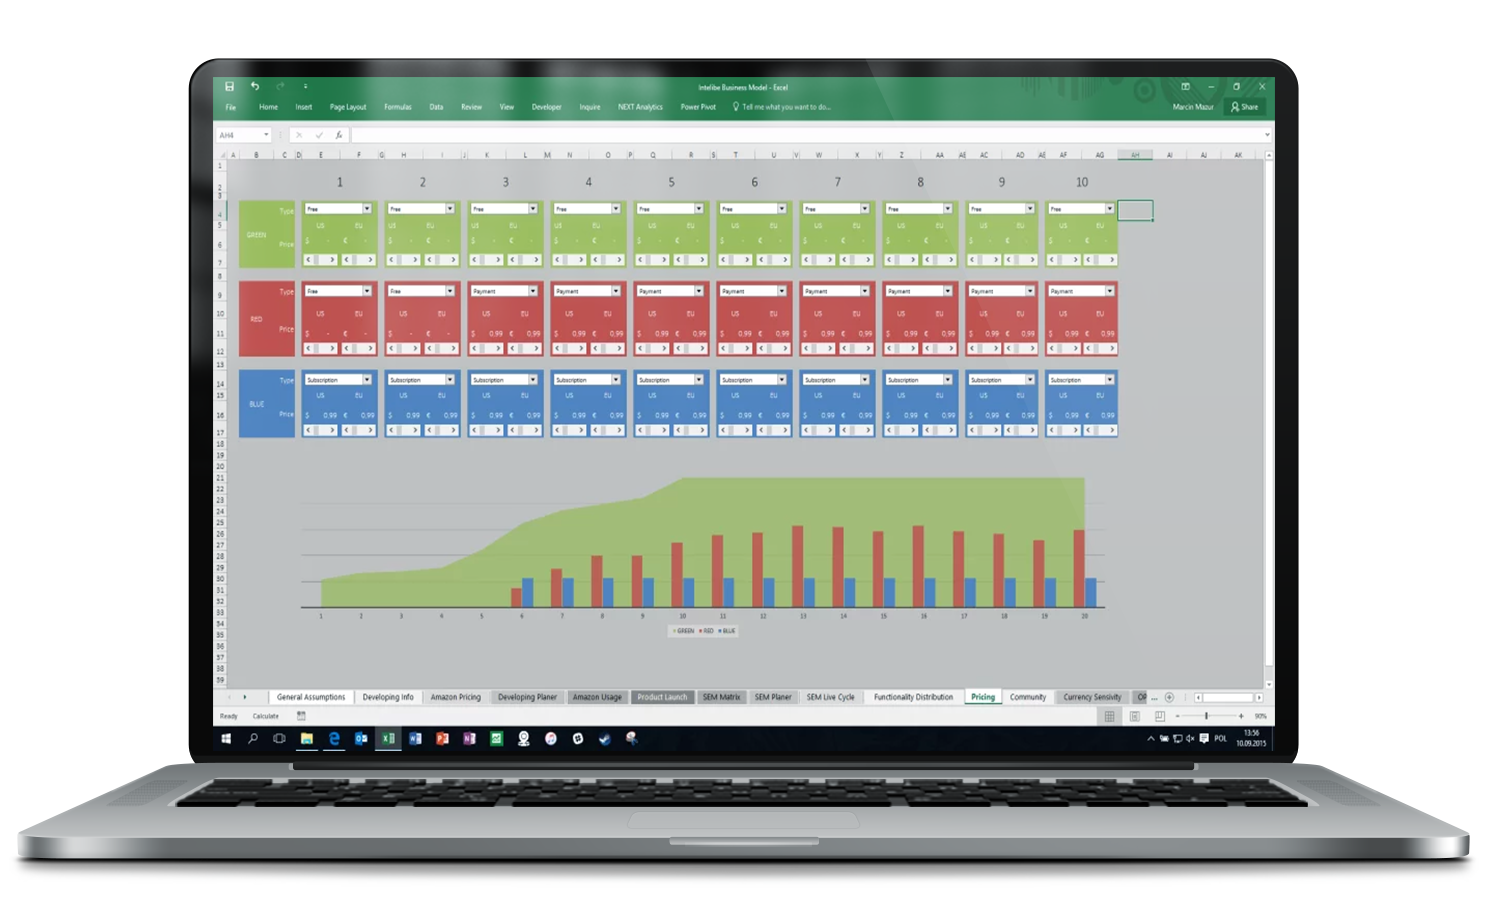
The model included a dynamic tool for creating and simulating service pricing.
This tool enabled:
- defining various revenue models (e.g., one-time fees, subscriptions),
- testing the impact of price levels on sales dynamics and financial performance,
- quickly adjusting pricing strategies to changing market conditions.
SEM LIVE CYCLE – Modeling User Growth Trends
Simulation of user growth dynamics and conversion analysis. The “SEM Live Cycle” module in the Intelibe model enabled:
- Dynamic modeling of various user growth trends over time (e.g., Trend 1, Trend 2),
- Controlling the growth rate by individually setting monthly increases (% change in number of users),
- Accounting for the adoption rate, i.e., the percentage of users who complete the registration or product activation process,
- Quick analysis of the impact of different adoption and growth scenarios on the project’s financial results.
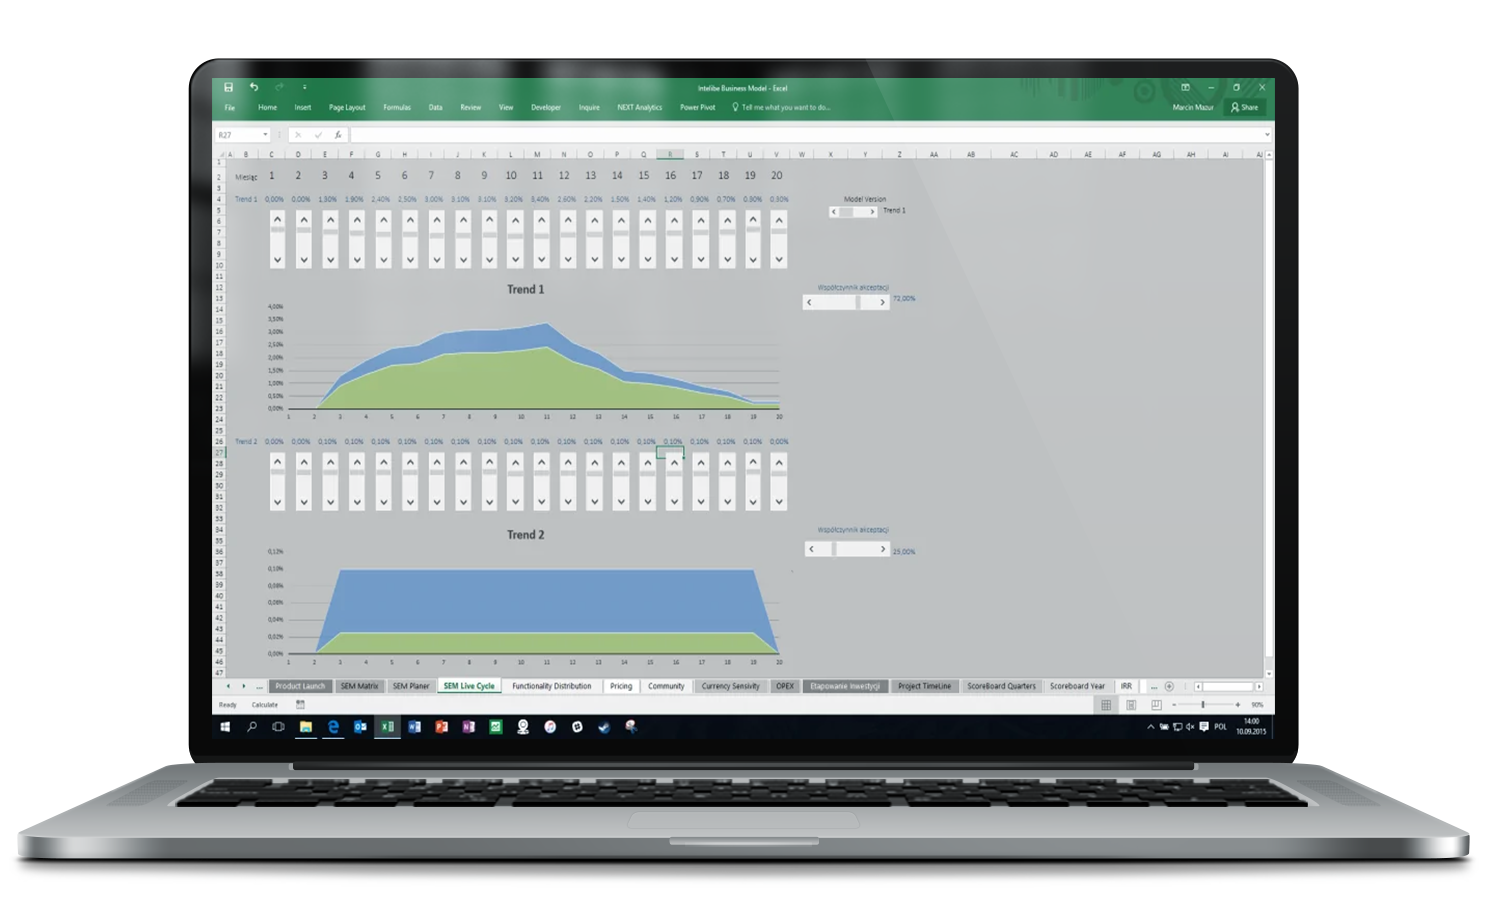
Significance for the project:
The model allowed for realistic mapping of user growth curves, which is crucial when forecasting revenues in SaaS and mobile applications.
It provided the ability to build optimistic, realistic, and cautious user growth scenarios. It supported decision-making about the pace of investment in marketing and product development depending on market growth rates.
In summary:
Thanks to the SEM Live Cycle, the Intelibe project gained a flexible and precise tool for simulating future customer base growth, which significantly increased the financial model’s credibility with investors.
Dynamic OPEX Modeling
Dynamic OPEX – operational cost control
The OPEX module enabled:
- Detailed planning and updating of operational costs over time,
- Flexible analysis of the impact of individual cost items on financial results,
- Preparation of operational budgets tailored to various growth scenarios.

MILESTONE VISUALIZATION
Key milestones – project and risk management.
The model included:
- a schedule of key product development stages,
- tracking achievement of planned goals over time,
- minimizing the risk of cost and deadline overruns.
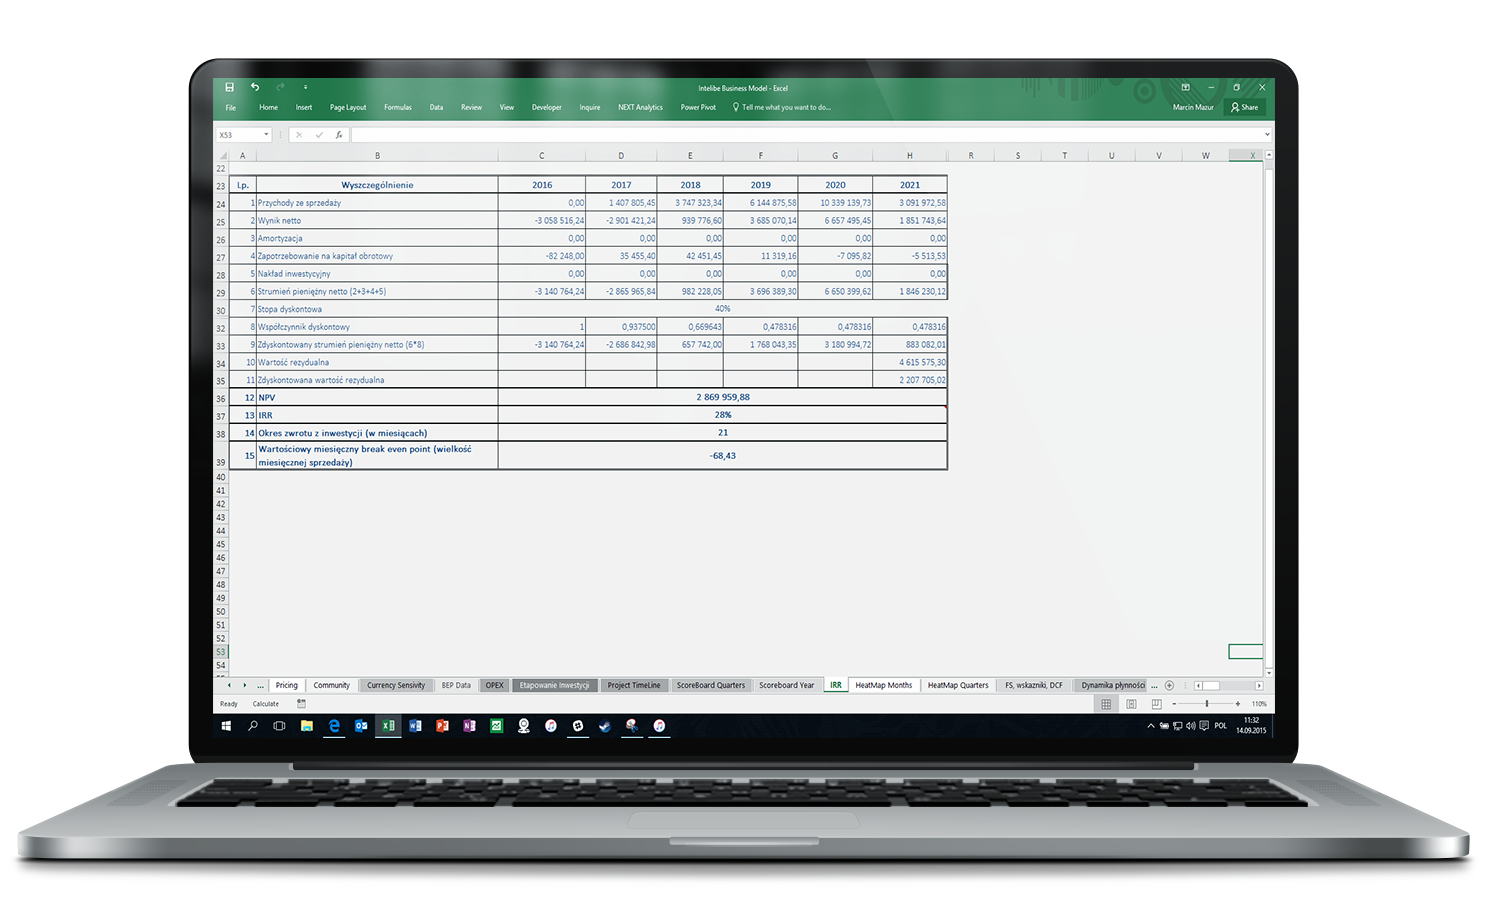
DCF Valuation Method
Project valuation using the DCF method – investment value analysis.
The model included a discounted cash flow (DCF) valuation module, enabling:
- calculation of the project’s net present value (NPV),
- determination of the internal rate of return (IRR),
- analysis of the investment payback period.
Operational Cost Analysis and Scalability
Analysis of operational costs and scalability.
The model allowed for:
- dynamic simulation of the impact of costs on financial results,
- testing scenarios for scaling costs as the user base grows,
- preparing operational budgets adapted to company growth.
The financial model included:
- simulation of various user base growth scenarios,
- analysis of the impact of changes in revenues and costs on EBITDA and cash flow,
- ability to quickly test different business strategies.
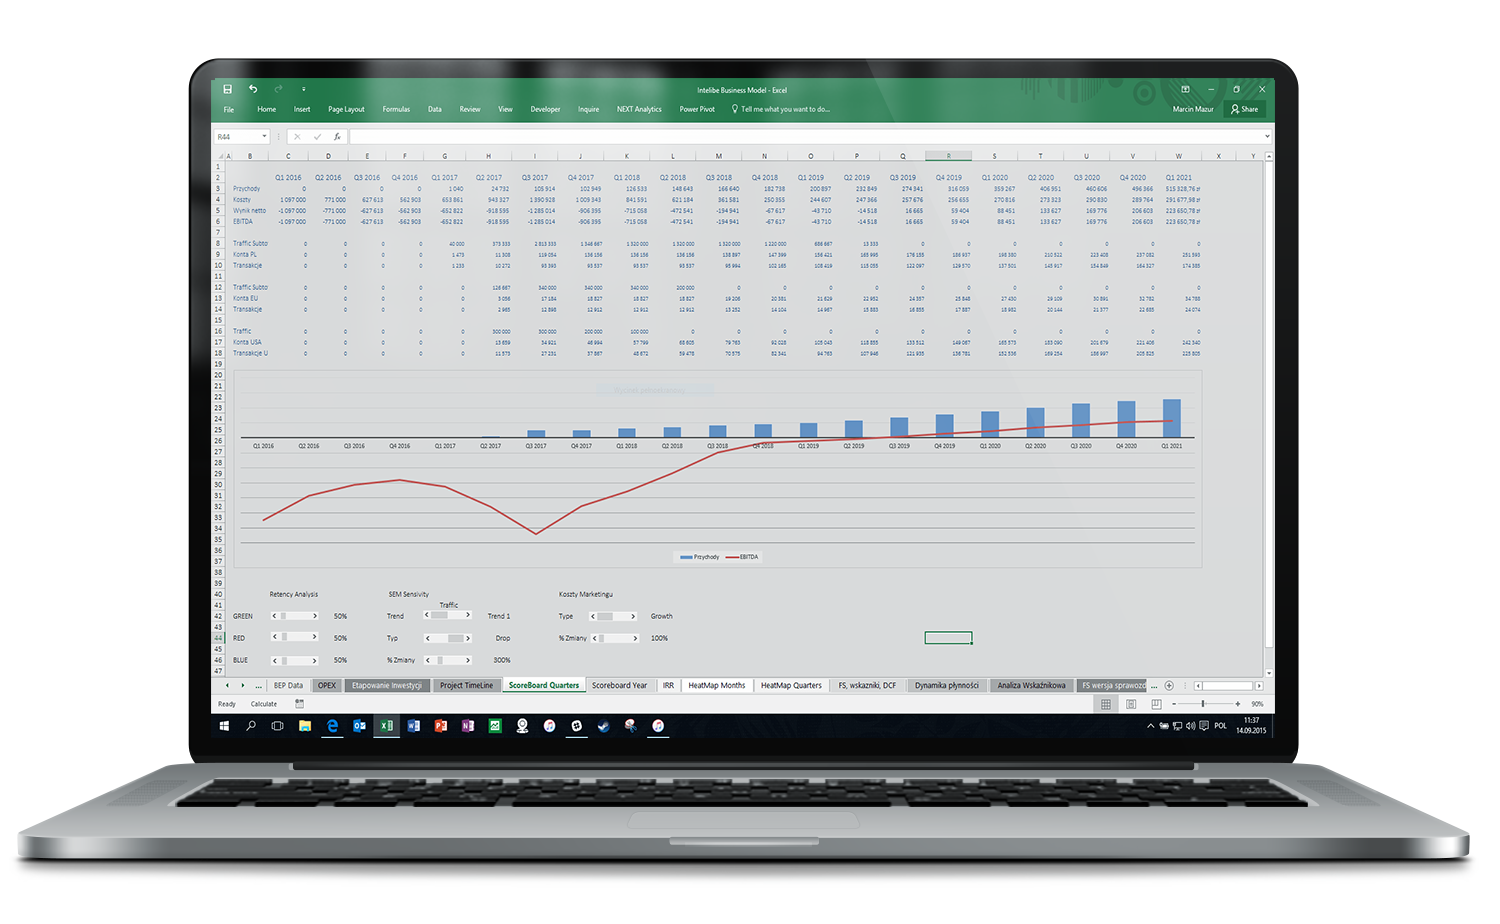
FINANCIAL DASHBOARD AND SCENARIO ANALYSIS
Financial dashboard – real-time performance analysis
The interactive dashboard displayed the project’s key financial indicators, such as:
- revenue and cost dynamics,
- EBITDA, EBIT, net profit,
- simulations of the impact of user traffic changes and server costs on project profitability.
This allowed investors to immediately assess the impact of various business and market decisions on financial performance.
The next section of the dashboard allowed users to:
- analyze the impact of different monetization strategies and costs on EBITDA and net profit,
- quickly model changes in user volume, ARPU (average revenue per user), and acquisition costs,
- support data-driven management decision making
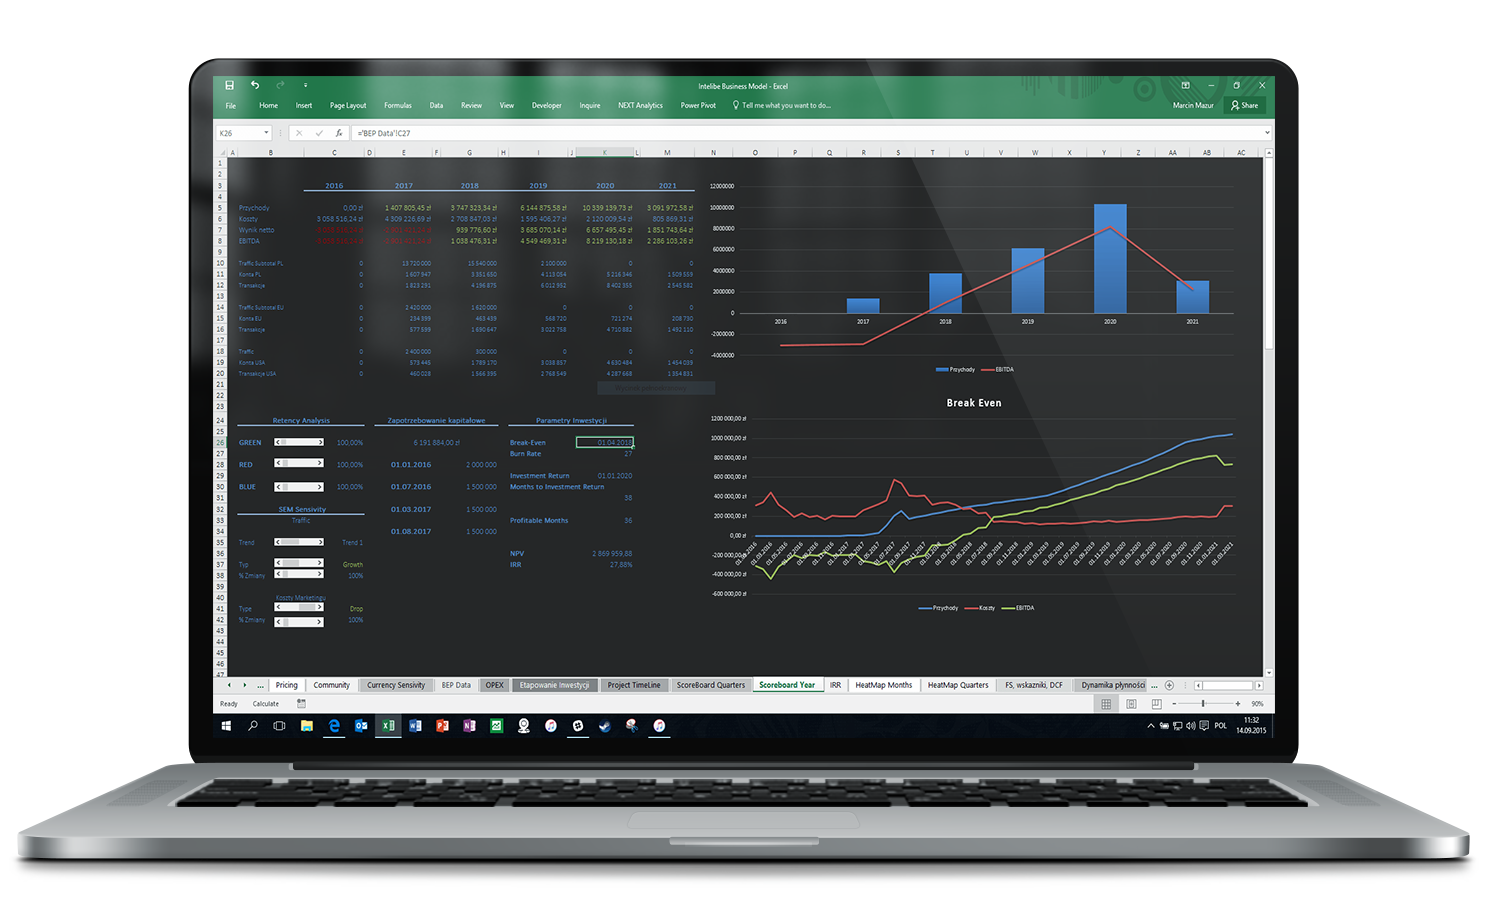
Advanced performance projection included:
- modeling multiple market development scenarios,
- analyzing the growth rate of the user base and revenues,
- identifying break-even points under different cost conditions.
Profit and Loss Statement (P&L) – comprehensive project profitability analysis
The model included a full profit and loss account for subsequent years, enabling:
- analysis of gross margin and operating margin,
- assessment of the impact of pricing and cost strategies on net profit,
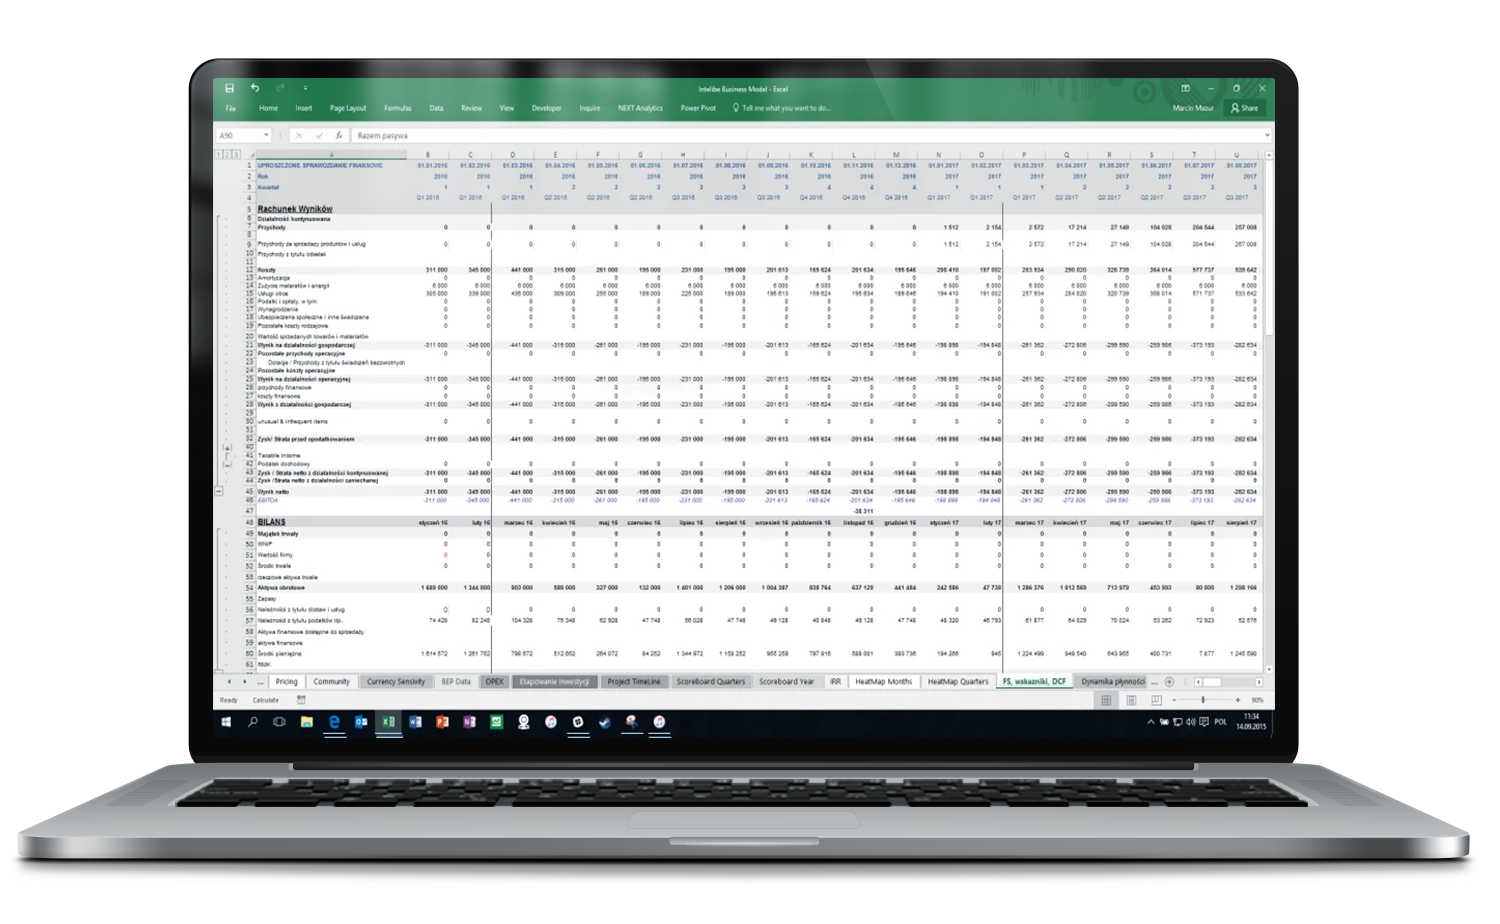
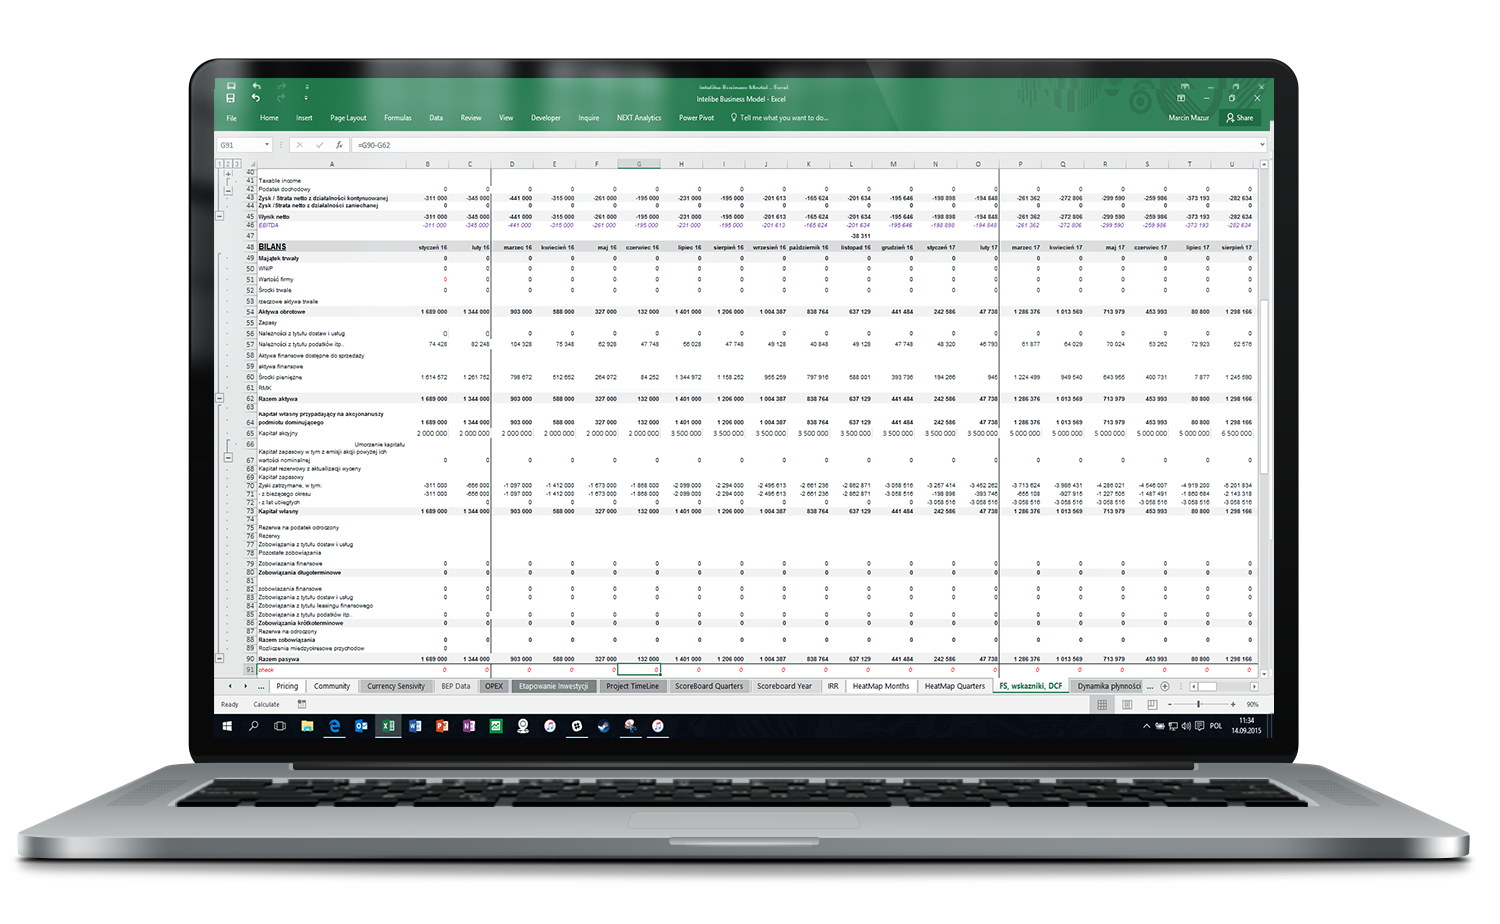
Balance Sheet and Financial Result
Balance sheet and profit and loss statement – the foundation of the financial forecast
The model included a full balance sheet and profit and loss statement based on realistic operational data.
Thanks to linkage with other model modules (revenues, costs, investments, financing), it enabled:
- dynamic tracking of project profitability in various development scenarios,
- analysis of liquidity and financing structure at each project stage.