
Development of a financial model supporting the launch and growth of a VoD service within the operations of a cable network operator.
Project goal: Assessment of the profitability of investment in the VoD service
SCOPE OF THE FINANCIAL MODEL:
Revenues:
- Subscriptions (basic and premium packages)
- Pay-Per-View (one-time transactions)
- Advertising revenues (AVOD or hybrid models)
The model included the ability to separate financial results for the VoD segment from the operator’s existing business – enabling margin and investment return analysis specifically for the VoD service.
Cash burn levels and the moment when the service becomes profitable (break-even at a given ARPU and churn rate) were estimated.
Costs:
- Content (licenses, usage-based settlement)
- Technical costs (platform maintenance)
- Marketing and user acquisition
- Customer support, administration
Investments (CAPEX):
- Technology platform (OTT)
- Integration with existing systems
- Launch campaigns
BUSINESS SCENARIOS
The model was designed for comparing commercial offers from various content and technology providers.
It enables assessment of:
- the total cost of individual proposals,
- licensing terms (fixed fee vs revenue share),
- initial investments required (technology, integrations, launch campaigns).
Additionally, it supports decisions regarding:
- the structure of the offer (premium, bundled packages),
- the duration and flexibility of agreements with suppliers,
- the potential impact on EBITDA and cash flows.
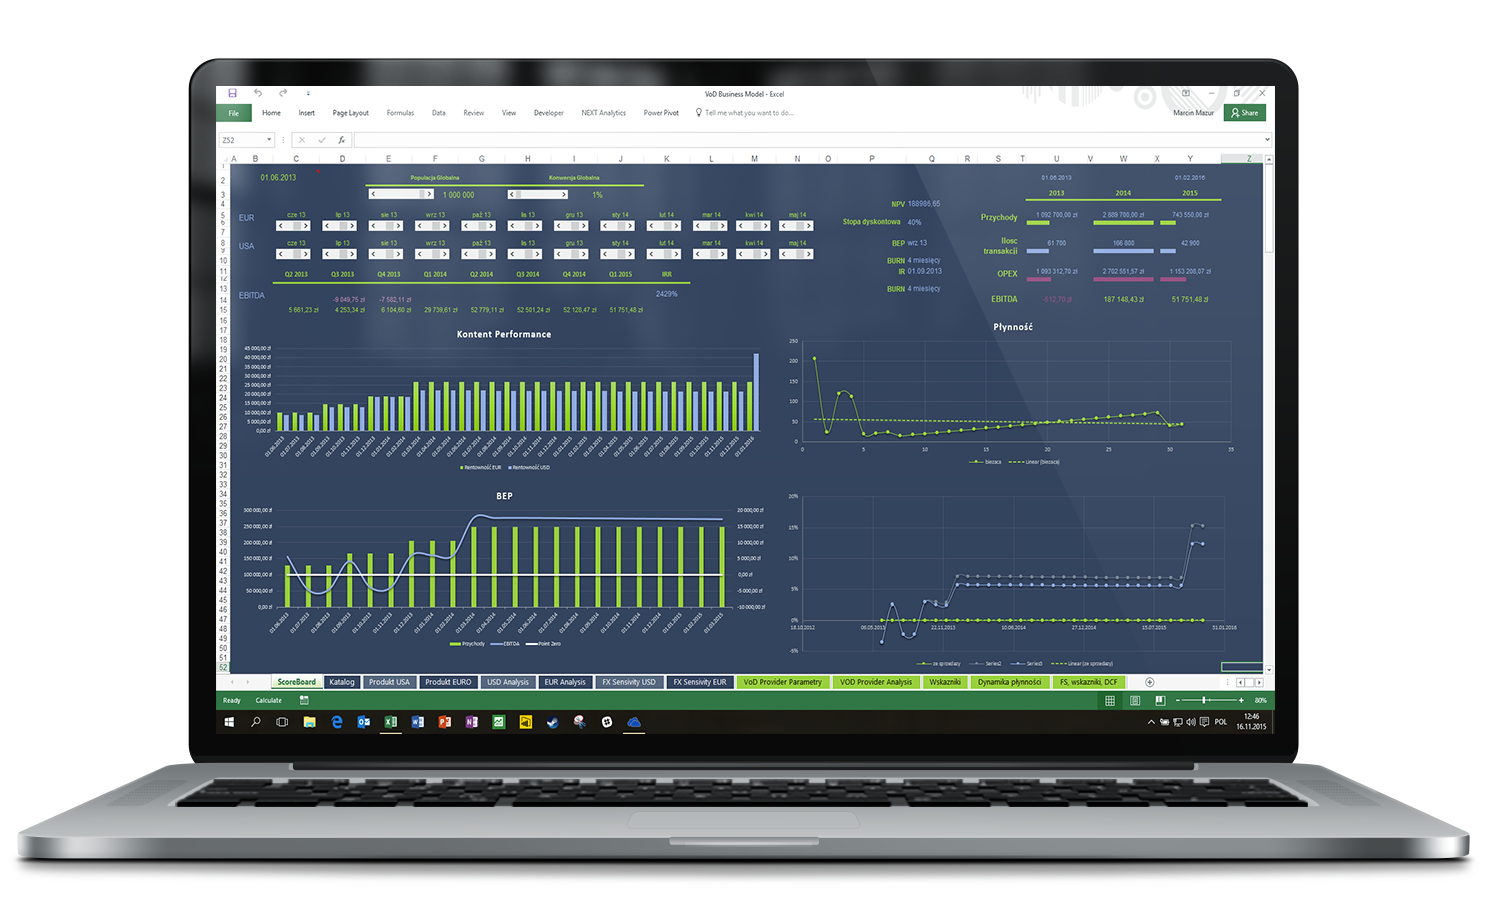
FINANCIAL MODEL – FINANCIAL DASHBOARD
The model enables assessment of:
- Content packages – various scopes from different aggregators
- Billing models – fixed fees / per user / revenue share
- OTT technology platform offers – differences in implementation costs, SLA, and user support
- Required marketing investments.
Each scenario is reflected in:
- revenue and cost forecasts
- investment schedule
- cash flow and financial ratio analysis (NPV, IRR)
PRICING STRATEGIES
The model allowed testing of various pricing strategies and VoD service growth paths:
Pricing strategies and ARPU:
- Different package price levels were defined (basic, premium, pay-per-view).
- The model enabled assessment of how changes in ARPU affect profitability and EBITDA levels.
Growth scenarios:
- Various scenarios were simulated:
- Each had its own assumptions regarding customer acquisition pace, retention, churn, and acquisition costs.
- It was possible to test the impact of marketing campaigns on user growth.

LTV/CAC and churn analysis:
- The long-term customer value (LTV) was calculated based on ARPU, customer lifetime, and servicing costs.
- This was compared to customer acquisition costs (CAC) under various marketing strategies.
- Dynamic recalculation of metrics over time was possible – e.g., after increasing churn by 5% or changing the marketing budget.
Cash flow modeling:
- Cash flow was generated on a monthly and quarterly basis.
- It was possible to analyze the impact of investment or campaign delays on liquidity.
- Schedules for payments for content, integrations, and delays in customer inflows were included.
The model enabled testing of various pricing strategies and VoD service development paths:
Pricing strategies and ARPU:
- Different package price levels were defined (basic, premium, pay-per-view).
- The model allowed assessment of how changes in ARPU impact profitability and EBITDA levels.
Growth scenarios:
Various scenarios were simulated:
- Each scenario had its own assumptions regarding customer acquisition rate, retention, churn, and acquisition costs.
- It was possible to test the impact of marketing campaigns on user growth.
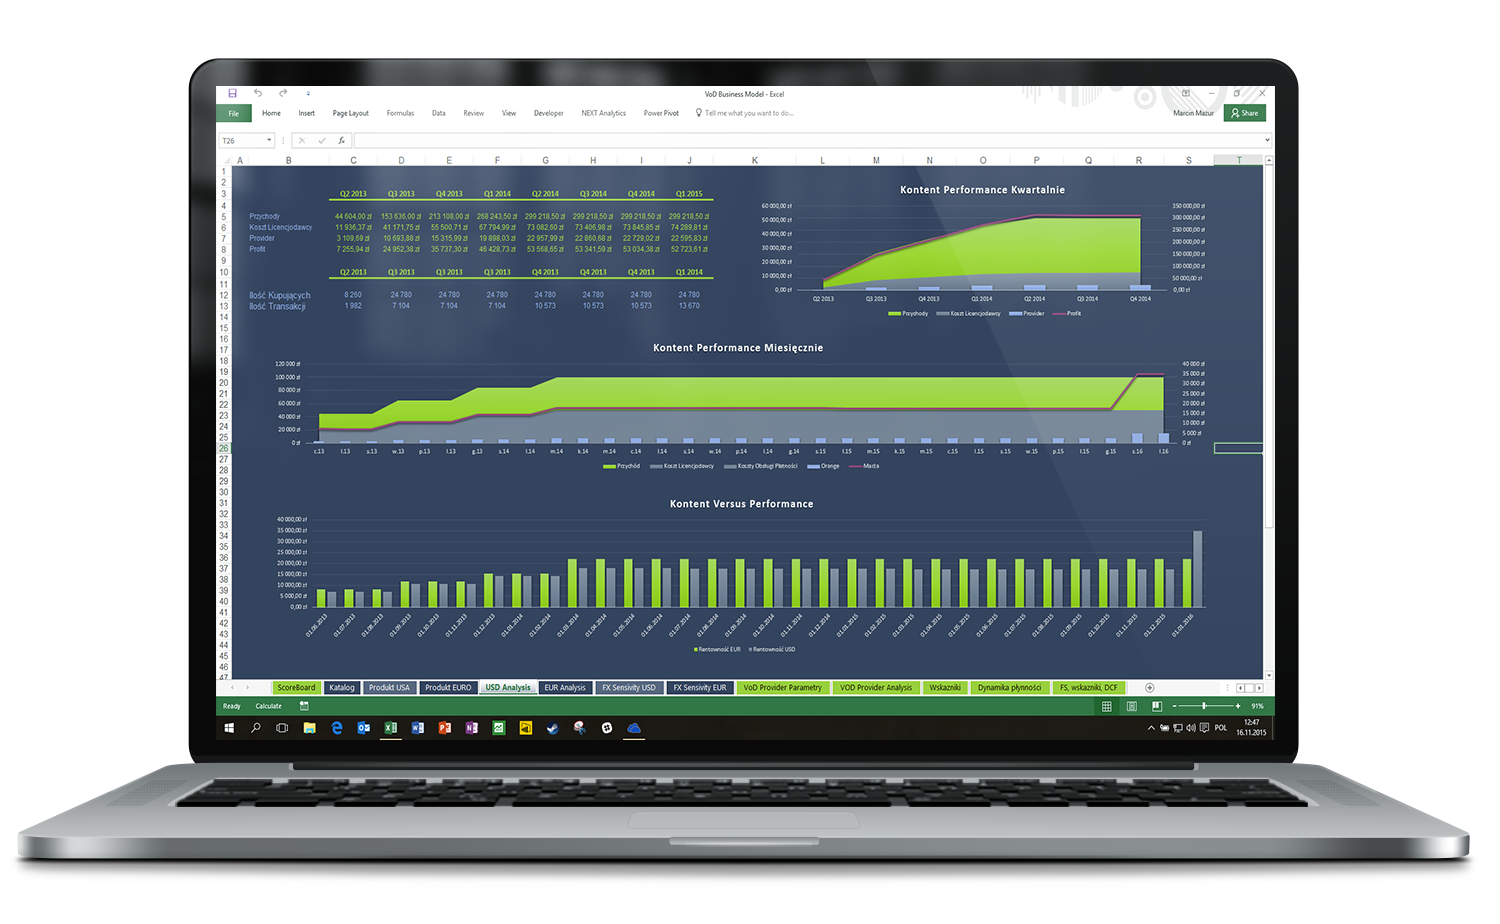
FINANCIAL MODEL – FINANCIAL DASHBOARD
The financial model accounted for the fact that the main licensing and technology contracts were denominated in USD and EUR. A module was built in to simulate the impact of exchange rate changes on:
- the total costs of content providers,
- profitability and EBITDA levels.
It was possible to dynamically change exchange rates over time (taking into account forecasts or strategic assumptions).

The model user could test any scenario, including:
- stable exchange rate (long-term contract),
- appreciation of the zloty (cost reduction),
- depreciation of the zloty (risk of increased CAPEX and OPEX).
For each scenario, the model generated:
- an update of projected cash flows,
- changes in the project’s IRR and NPV,
- new break-even points for each analyzed provider.
PRACTICAL APPLICATION OF THE MODEL
Cash burn levels and the moment when the service becomes profitable (break-even at a given ARPU and churn rate) were estimated.
The model was used for:
- presenting the project to the management board and industry investors,
- comparing 3 alternative market entry strategies,
- developing negotiation arguments for content provider contracts,
- planning the investment financing path – using both equity and debt financing.