Advanced Data Visualization in Power BI – Analysis of Platform User Purchasing Behavior
The following Power BI report was created as a proof of concept, designed to showcase competencies in:
- integrating Power BI with a historical database designed in 2012,
- processing and aggregating large datasets involving ingestion data (i.e., anonymous user behavior data),
- building interactive analytical models to support market decisions.
The report demonstrates capabilities in:
- acquiring and transforming data from external sources,
- developing advanced DAX formulas for extracting additional layers of insight,
- analyzing sales trends and demand in the segment of Apple iPhone products.
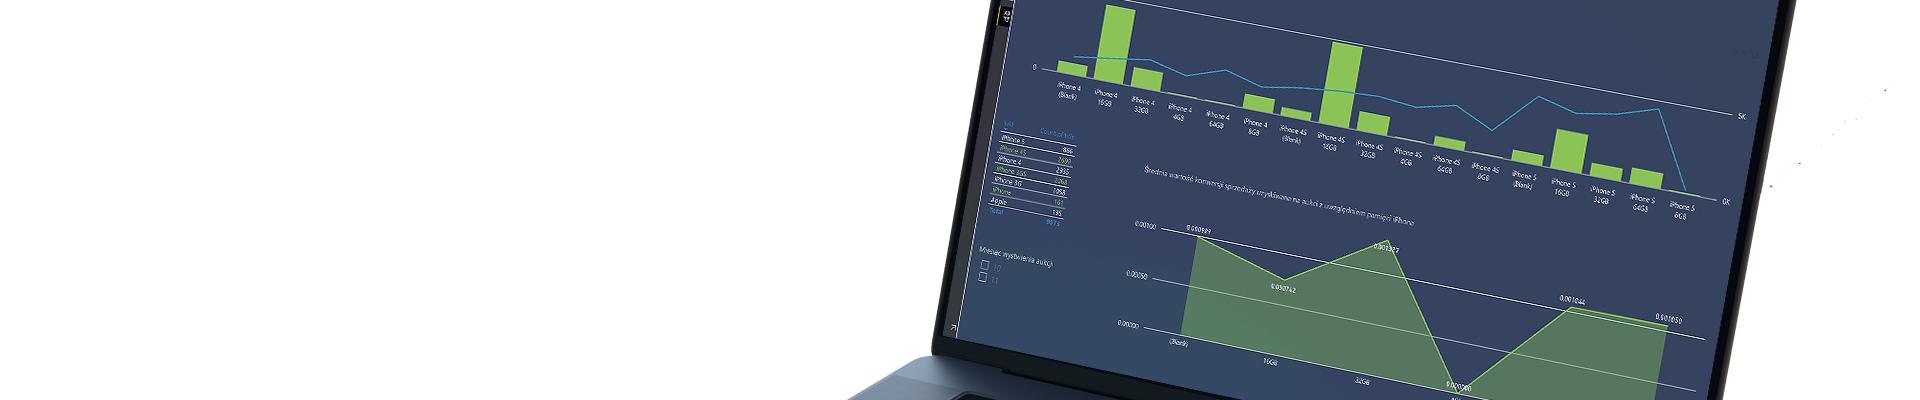
An example visualization illustrates a segment of the mobile phone market analysis, including:
- which iPhone models were most viewed and purchased,
- how user preferences changed over time (e.g., the dominance of the 4s model with 16 GB memory),
- actual conversion rates, including sales time and auction efficiency.
By skillfully utilizing DAX language, it was possible not only to obtain precise operational data but also to derive concrete business conclusions.
Among the most interesting findings was the observation that 32 GB models sold the fastest—even though users more frequently viewed the 16 GB versions.
This report is just a sample of broader analytical capabilities that can be achieved by integrating a well-designed database with Power BI.
It demonstrates how available tools can be used to build an analytical tool that genuinely supports business decisions.