
Secondary Market and User Behavior Analysis.
Project completed: 2016
Project Goal
Creation of a BI system tracking user activity in the secondary video game market—recording listed offers, responses to offers, and completed transactions. The aim was to build a comprehensive view of supply, demand, and price trends, as well as to support:
- determining realistic buying and selling prices for games,
- analyzing game title popularity,
- precise user segmentation with regard to advertising campaigns.
Challenge:
The system needed to include:
- tens of thousands of offers listed and received by users,
- data about games, their declared value, number of trades, offer statuses (completed, rejected, no response),
- transaction data and user behavior over the years.
All had to work in Excel, without the need for commercial BI tools.
Solution
The developed system:
- was based on Power Pivot and DAX, powered by data from MySQL,
- analyzed: market value, number of transactions, game interest, offer success, etc.,
- enabled filtering by game title, offer type (cash, trade), platform, media version, account status,
- allowed targeting users for specific marketing actions – e.g., active players, those without completed offers, owners of popular titles.
Key Features of the System
- Demand and supply overview – how many people are searching for a specific game, how many are offering it, average response time, and how many end in a transaction.
- Secondary market value – total value of all listed games, overall value of offers (cash vs exchange).
- Trend analyses – e.g., decline in interest for a particular game series or increase following the release of a new installment.
- Offer success rate – number of completed offers for a given game compared to the number of listings.
- Comparison of demand versus availability – shows which games are in high demand but hard to obtain – ideal for dynamic buy price setting.
Results
- Market insights – which titles have the greatest sales and purchase potential.
- Automated pricing for buying and selling used games.
- User group identification for remarketing campaigns – e.g., players who tried to sell a game three times without success.
- Spotting purchase opportunities – games available well below average market value.
General Dashboard – Market Structure, Prices, and Game Interest
Description:
The main analytics screen combines data on the value of listed offers, game interest, and overall market structure.
Key elements:
- Pie chart: share of “for sale” vs “wanted” offers.
- Line and bar chart: player activity over time – number of offers, logins, trades.
- Offer value comparison: cash offers vs declared game value.
- “Games Availability vs Interest” breakdown – how many copies of a game are being offered vs. how many are being sought after.
Effect:
Helps understand which games are undervalued on the market and which have demand exceeding supply – these are key insights for pricing and sales campaigns.
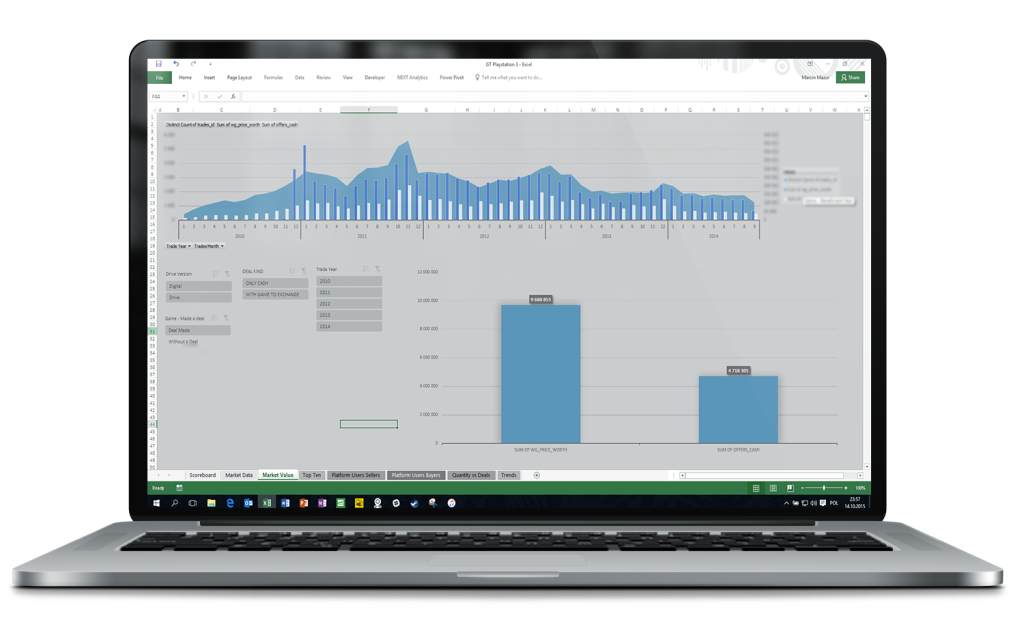
Market Value and Transaction History
Description:
A view analyzing the monetary value of the market over time – split into exchanges and cash transactions.
Key elements:
- Stacked bar chart: number of transactions over the months and their total value.
- Segmentation: by game version (digital/physical), offer type (cash/exchange), transaction year.
- Comparison: total value of games on the market vs. total amount of cash paid.
Effect:
Allows estimation of the real trading potential of the platform, identification of seasonal peaks (e.g., December), and drawing conclusions regarding pricing strategy.
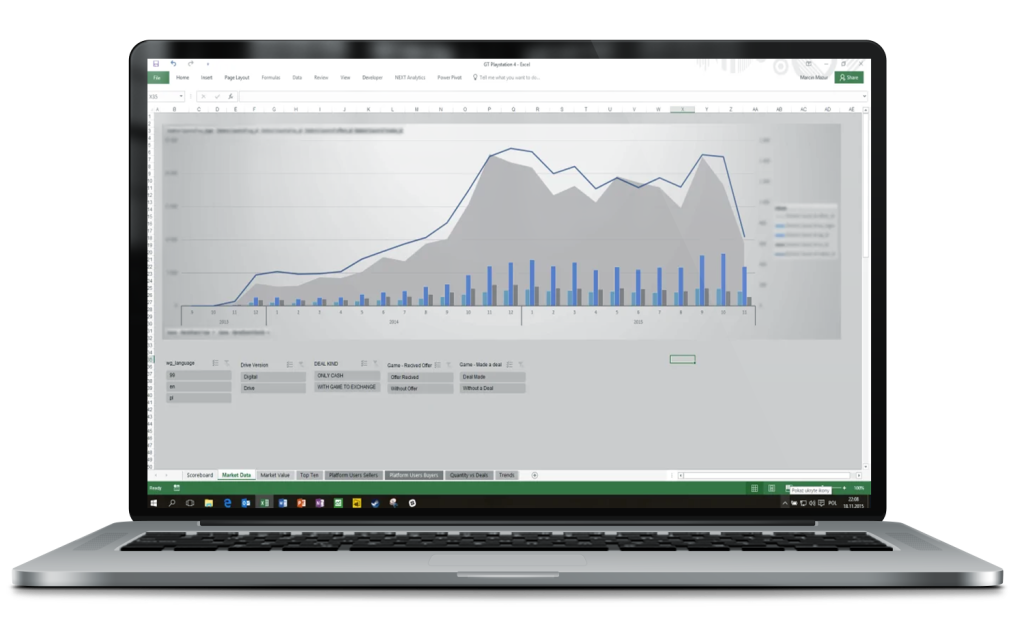
PS4 Dashboard – Market Behavior after Releases and Popularity Peaks
Description:
A view dedicated to PS4 market analysis for the 2014–2015 period. Central focus: offer and login dynamics, and interest in the latest titles.
Key elements:
- Top chart: offer and login trends – with distinct peaks after new releases.
- Market value split by month.
- Game ranking – most sought after vs. most frequently offered.

Effect:
Allows for instant detection of changing consumer trends – for example, a new game appears but very few people are offering it = an ideal title to focus buying efforts on.
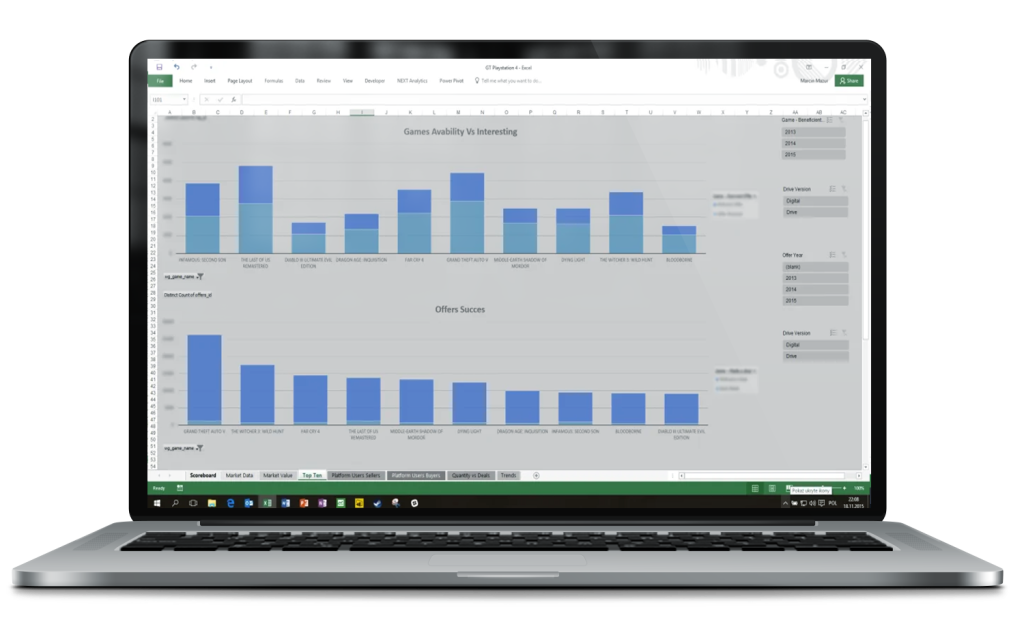
Detailed Comparison of Supply and Demand
Description:
Comparison of game availability against the number of players searching for (interested in) each game.
Key elements:
- Top chart: “Games Availability vs Interest” – number of offers vs. number of interested buyers.
- Bottom chart: “Offers Success” – how many offers resulted in a transaction.
- Segmentation by game title, version, and offer type.
Effect:
Helps accurately identify games with a low offer success rate – for example, lots of interested buyers but few sellers = potential opportunity to capture the market.
Market Value Analysis by Transaction Type
Description:
A view showing the value of transactions in a given period – broken down into cash and declared game value.
Key elements:
- Value chart: total value of all offers and actual transaction amounts.
- Filters by game version, offer type, year.
- Year-to-year comparison – market value increase/decrease
Effect:
Helps understand the direction of the market – whether the value of cash offers is increasing or exchanges are dominating the trading structure.
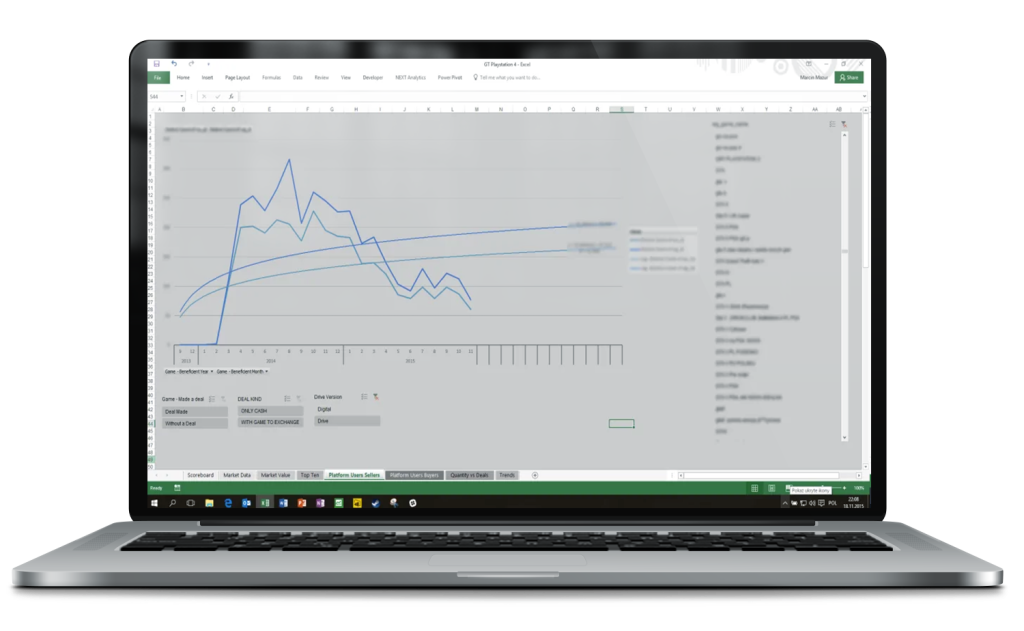
User-Seller Behavior Indicators
Description:
Trend charts of user activity for those listing games for sale – analysis of their effectiveness and persistence.
Key elements:
- Login and listing trends.
- Groups: cash only, exchange only, both types.
- Comparison: users who “completed” vs. those who “did not complete” any transaction.
Effect:
Identifies users with high conversion potential for advertising and remarketing actions – e.g., reminders about unfinished offers.