
At Origami Effect, custom reporting and controlling systems are built to deliver real-time insights and streamline financial oversight.
Solutions help monitor performance, control costs, and support informed decisions with confidence, all tailored to business requirements.
What Is Offered
Systems integrate data from ERP, APIs, spreadsheets, and databases to provide accurate, automated reporting and controlling tools. The approach combines the best technologies—Excel, VBA, Power Query, Python, and MySQL—for seamless, scalable performance.
Key Features of Systems
Real-Time Reporting:
Track KPIs, financial metrics, and operational performance instantly.
Automated Data Processing:
Eliminate manual work by pulling data from multiple sources.
Cost Control:
Monitor budgets, expenses, and variances to optimize financial performance.
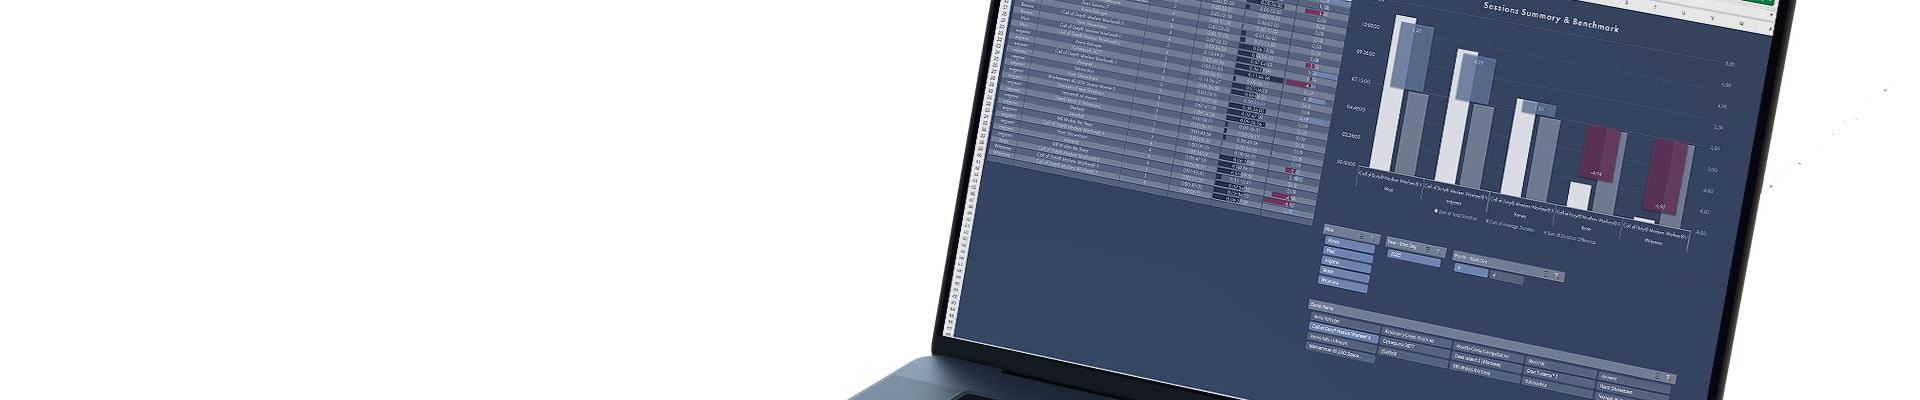
Custom Dashboards:
Visualize data with intuitive charts and reports tailored to business requirements.
Risk Management:
Identify trends, anomalies, or risks early to stay proactive.
Why Choose Systems?
Tailored to Each Organization:
Designed to fit unique business processes, goals, and data structure.
Hybrid Technology:
Leverages Excel’s accessibility, VBA automation, Power Query’s data processing, Python’s analytics, and MySQL’s robust data management.
Proven Efficiency:
Saves time, reduces errors, and enhances financial control.
Real-World Examples:

Battlefield 6 Advanced Analytics & AI Insights
A complete analytics solution for Battlefield 6, combining interactive dashboards, real-time Discord alerts, machine learning predictions, and AI-generated insights powered by OpenAI.
Game Time Analytics & Visualization
Interactive dashboards and reports that reveal player engagement and time spent in games, helping gaming companies optimize user experience.

Power BI and PostgreSQL Integration
Seamless integration of Power BI with PostgreSQL for real-time analytics and dynamic business insights.

Purchase Behavior Analysis
In-depth analysis of customer purchasing patterns to boost sales strategies and personalize shopping experiences.

Advanced Data Visualization in Power B
Cutting-edge visualizations and interactive dashboards that transform complex data into actionable insights.

Excel Dashboard Powered by Google Analytics API
Automated Excel dashboards integrated with Google Analytics for instant access to key marketing metrics.

Secondary Market and User Behavior Insights
Comprehensive analysis of secondary market trends and user behavior to support strategic business decisions.

User Registration Monitoring System
Real-time monitoring of user account registrations to ensure secure and efficient onboarding processes.

BI Solution for Online Currency Exchange
Business Intelligence system for currency exchange platforms, delivering full control over financial data and market trends.

E-Commerce Intelligence Dashboard
Smart analytics solution for e-commerce businesses to track sales, customer behavior, and campaign performance.