
Themis is a proprietary, modular analytical system designed for the automatic analysis of real estate offers and their full locational context.
The system collects, normalizes, and interprets market data, creating a consistent and comparable information base used in further decision-making and financial analyses.
Themis serves as the data and analysis layer preceding the financial model — in particular, it feeds Artemis – Financial Model for Real Estate, providing it with verified, versioned, and auditable input data.
Key Features
Main Business Objective:
- Replaces manual benchmark collection → shortens due diligence from weeks to hours
- Provides objective data to the Commercialization and Pricing module in Artemis (ADR, occupancy, seasonality, tenant profiles)
- Enables realistic revenue forecasts (RevPAR, NOI) and locational risk assessment already at the modeling stage
- selection of offers and locations (go / no-go),
- comparison of location attractiveness,
- identification of offer and market risks,
- preliminary due diligence,
- preparation of data for revenue forecasts and scenario analyses.
In practice, Themis answers the question:
Does the project in this location make sense before it is included in the financial model?
Technology:
Themis is a hybrid system that uses, among others:
- Automation and ETL: Python, Power Query (M), VBA, SQL
- Database: MySQL
- Visualization and analysis: Microsoft Excel (Power Query, VBA)
- Machine Learning: LightGBM, CatBoost, Random Forest
- Integrations / API: Microsoft Graph, AirRoi, OpenAI API, xAI, Google Maps, OpenStreetMap, GUS / REGON
Data Sets:
Themis works with a broad spectrum of market and locational data, integrating information provided by specialized external entities with its own analytical layer.
The system uses reports and data sets describing the real estate market, prices, offer activity, and locational context, which are then:
- normalized to a common data model,
- enriched with spatial and statistical context,
- analyzed statistically and comparatively,
- processed using proprietary analytical and machine learning models.
Thanks to this, Themis is not merely an information aggregator, but a data interpretation and processing system that transforms heterogeneous reports and source sets into a coherent, comparable decision-making space.
Example Analytical Report: Location Attractiveness Summary
Location Attractiveness Summary is a synthetic location attractiveness assessment report built on Themis’s geolocational data layer.
Its purpose is to provide an objective comparison of locations based on the availability of infrastructure, services, and positive and negative factors relevant to the chosen investment or usage profile.
Scope of Locational Analysis
For each analyzed location, Themis:
- identifies all relevant objects and amenities within a given radius (e.g. 0.5 km / 1 km / 2 km),
- allows the use of thematic filters (transport, gastronomy, services, education, health, recreation, technical infrastructure),
- takes into account both positive factors and negative factors affecting location attractiveness.
The analysis is performed consistently for all locations, enabling direct comparisons.

Scoring and Weights
Each object category has an assigned weight and logic of impact on the result:
- positive points (e.g. restaurants, public transport, shops, services),
- neutral points,
- negative points (e.g. technical infrastructure, burdensome objects).
Scoring:
- is aggregated separately for different radii from the analyzed point,
- is presented by category and as a total score,
- can be customized to the project profile (e.g. PBSA, Office, STR).
Benchmarks and Competitive Comparisons
The report can be extended with a benchmark mode, in which:
- the analyzed location is compared with other projects (e.g. competing investments),
- differences in the availability of infrastructure and services are presented,
- areas of advantage or weakness of the location can be identified.
This allows the report to support not only absolute assessment but also project positioning relative to the market.
Qualitative Interpretation (AI)
The quantitative results of the report are additionally interpreted using language models (including GPT and xAI), which:
- analyze the structure of points in selected categories,
- provide insights from the perspective of specific target groups (e.g. students, short-term tenants, office workers),
- identify key advantages and limitations of the location in natural language.
The result is a combination of:
- hard numerical data,
- comparative scoring,
- clear, qualitative conclusions.

Short-Term Rental (STR) Market
Themis uses data from AirROI, among others, for comprehensive analysis of the short-term rental market, downloading listings and market metrics.
Thanks to this data, the investment project analyst can:
- Assess the real investment potential of the property by comparing average prices, revenues, and occupancy over time,
- Compare competitive offers in the selected location, taking into account property type, amenities, and additional features,
- Forecast revenues and profitability scenarios based on historical price, occupancy, and booking trends,
- Account for locational factors such as proximity to transport, business centers, or universities, which are key in demand modeling,
- Identify seasonal booking patterns and optimize pricing strategy in real time,
- Analyze tenant profiles and market preferences to better match the offer to demand,
- Monitor investment performance and risks related to competition and changing market trends.
Scope of AirROI data used in Themis:
- Listing identifiers and metadata: ID, source, timestamp
- Location: address, city, coordinates (lat/lon), district
- Property parameters: area, number of rooms, property type, amenities
- Pricing data: listing price, nightly rate, historical price changes
- Market metrics: ADR (average daily rate), RevPAR, occupancy, average length of stay
- Booking metrics: lead time, cancel rate, booking window
- Revenues: estimated and realized
- Ratings and reviews: star rating, number of opinions, sentiment (if available)
- Multimedia and offer attributes: number of photos, description, list of features (e.g. parking, balcony)
- Geocontext: distances to POIs (transport, universities, business centers)
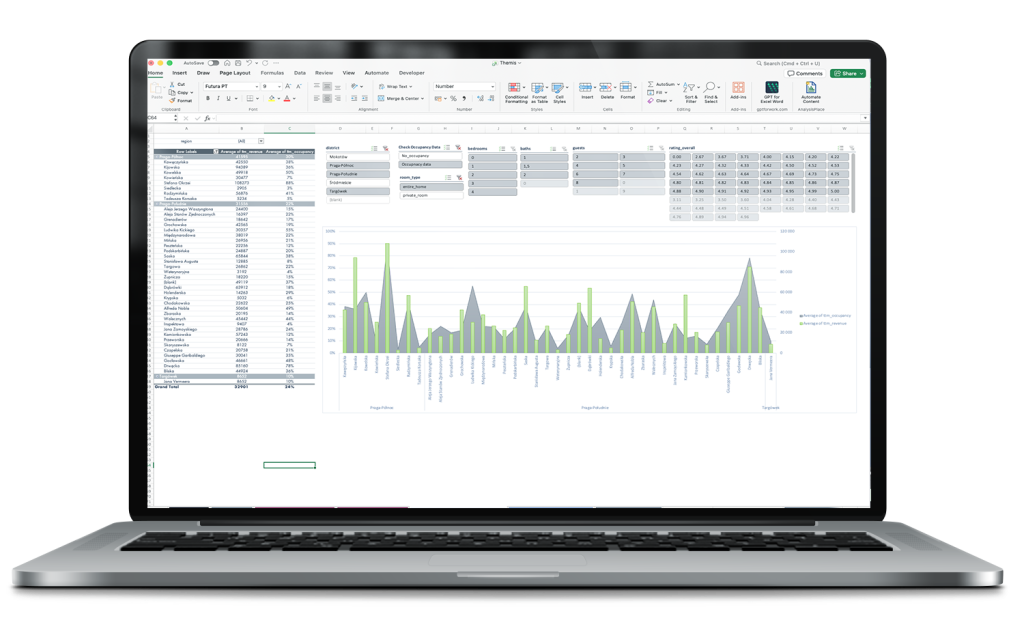
Example in Action: Benchmarking of micro-regions for short-term rental (STR) – AirROI dashboard in Themis
The Themis system aggregates and normalizes data from AirROI (and similar market sources), then presents it in intuitive, filterable Excel dashboards connected directly to the MySQL database.
The view below is a typical result of the Themis pipeline for the Warsaw micro-region – ready for analysis within seconds after refreshing.
How this data helps the analyst:
- In 30 seconds, they see which 3–5 micro-regions have real STR potential above 50–60% occupancy – no need to manually review hundreds of offers.
- They can immediately filter out unrealistic profiles (e.g. exclude 1-room studios or offers with rating <4.5) and compare only those that match the planned investment product.
- Easily identifies anomalies (e.g. why one district has 2–3× higher occupancy than neighboring ones)
- Data is ready to copy/import into the Artemis model – occupancy, RevPAR, seasonality feed directly into the Commercialization and Pricing module assumptions.
How this data helps the investor assess the viability of an STR investment in a given micro-region:
- Immediate answer to the key question: “Can I realistically achieve 60–80% occupancy and decent monthly revenue in this location?”
- Objective district comparison – instead of guessing, the investor sees hard numbers: City Center vs Praga-Północ vs Mokotów vs Targówek in terms of revenue and occupancy stability.
- Quick validation of business plan assumptions – if you assumed 65% occupancy and 420 PLN ADR in the Artemis model, but market data shows 24–38% in that district → you know you need to either change the location or the product profile.
- Lower risk of “mispricing” the market – the investor avoids buying in a micro-region where average revenues are 3–4× lower than in top locations.
- Support for decisions such as “entire apartment vs private room” or “premium vs budget” – just change the filters and see how the benchmark changes.
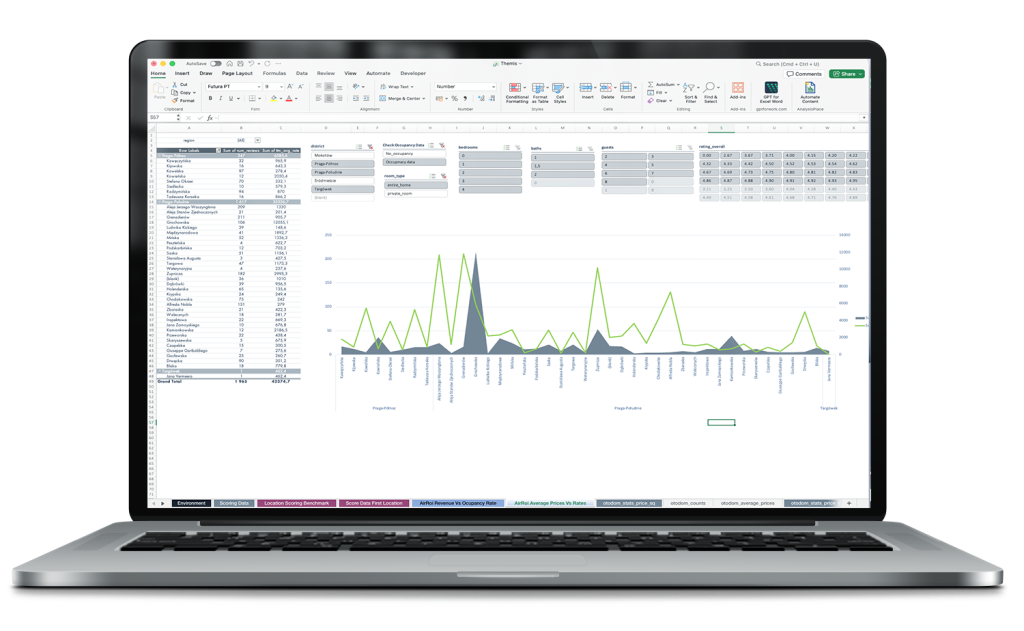
Example in Action: Comparison of average offer prices vs market rates (ADR / RevPAR) – AirRoi Average Prices Vs Rates dashboard in Themis
The Themis system pulls historical and current pricing and performance data from AirROI (daily rates, RevPAR, price changes), normalizes them by micro-region/district, and presents them in a filterable Excel view. The dashboard below is a typical result after import and aggregation – ready for analysis within seconds.
How this data helps the analyst:
- Immediate diagnosis of “whether the price is realistic vs the market” – the analyst sees in which micro-regions offers priced at X PLN/m² achieve ADR at level Y PLN – without manually checking hundreds of listings.
- Price elasticity analysis – quick check whether a 15–20% price increase in a given district still allows high occupancy and RevPAR (or whether the market is sensitive and occupancy drops).
- Identification of opportunities and pitfalls – e.g. districts with low ADR despite low purchase prices = signal of weak demand; districts with high RevPAR at average prices = potential upside.
- Direct feeding of the Artemis model – ADR / RevPAR / average prices per district data feed into the Pricing and Seasonality module, allowing realistic revenue curves instead of arbitrary assumptions.
How this data helps the investor assess the viability of an STR investment in a given micro-region:
- Key answer: “At this purchase/refurbishment price, can I achieve a sensible RevPAR and return?”
- Price efficiency comparison – the investor sees in which districts the market “pays” the highest daily rates relative to property price (e.g. RevPAR / price per m² → profitability ranking).
- Quick validation of pricing assumptions in the business plan – if you plan ADR 500 PLN but the district benchmark shows 320 PLN on average → you know you need to either target the premium segment or change the location.
- Minimization of “overheating” price risk – you avoid buying in a micro-region where high listing prices do not translate into proportionally higher rates (weak conversion to bookings).
- Support for strategic decisions – e.g. “should I target 2-room entire homes in Mokotów (high ADR but high entry price) or entire homes in Praga-Północ (lower ADR but better yield per invested zloty)”.
Themis not only aggregates raw market metrics from AirROI (such as ADR, occupancy, or RevPAR) but also enriches them with semantic analysis of listing content – including detailed assessment of property amenities.
AirROI data often contains rich descriptions (feature lists, photos, reviews) that are too numerous and unstructured for manual analysis.
This is where AI models come in: OpenAI (e.g. GPT-4) and Grok (from xAI), integrated into the Themis pipeline via versioned prompts.
AI processes amenity descriptions, infers strengths/gaps, assesses quality and risk, and then generates synthetic Markdown / Excel / SharePoint reports.
This enables automatic preparation of reports containing amenity analysis – e.g. completeness scoring, fit to tenant profile, or impact on occupancy.

Example Market Report Enriched by Themis
The Themis system can take ready-made reports from real estate portals and enrich them with additional analysis that enables quick conclusions and investment decisions. Below is an example of data for one offer:
How Themis enriches the report
-
Normalization and offer comparison – apartment prices and metrics are compared with other offers in the same district or property type (e.g. average price in Grochów, standard deviation, trend direction).
-
Pricing and spatial analysis – Themis calculates indicators such as average price per m², deviations, price ranges, and categorizes price variability.
-
Trend visualization – the report allows quick identification of stable market segments and anomalies (e.g. offers clearly more expensive or cheaper than the local average).
-
Support for investment decisions – the analyst sees which micro-regions and apartment types have potential under a realistic revenue scenario, without manually reviewing hundreds of offers.
-
Integration with financial models – values such as prices, average prices per m², and trends can be imported into Artemis modules (Commercialization, Pricing), significantly shortening the preparation of STR scenarios.
Benefits for the analyst and investor
- In a few seconds, identifies market segments with stable occupancy and attractive prices,
- Compares only offers meeting the criteria of the planned investment product (e.g. number of rooms, standard, rating),
- Easily spots anomalies and investigates further (POI, transport, competition – data from OSM in Themis),
- Reports are ready for direct use in financial models, significantly reducing analysis time and increasing the objectivity of decisions.