Polski
Power BI Reports
visualization of a database of an internet portal offering the possibility of exchanging and selling computer games.
The report was prepared to show the process of replacing the new generation of Playstation 4 vs Playstation 3 games
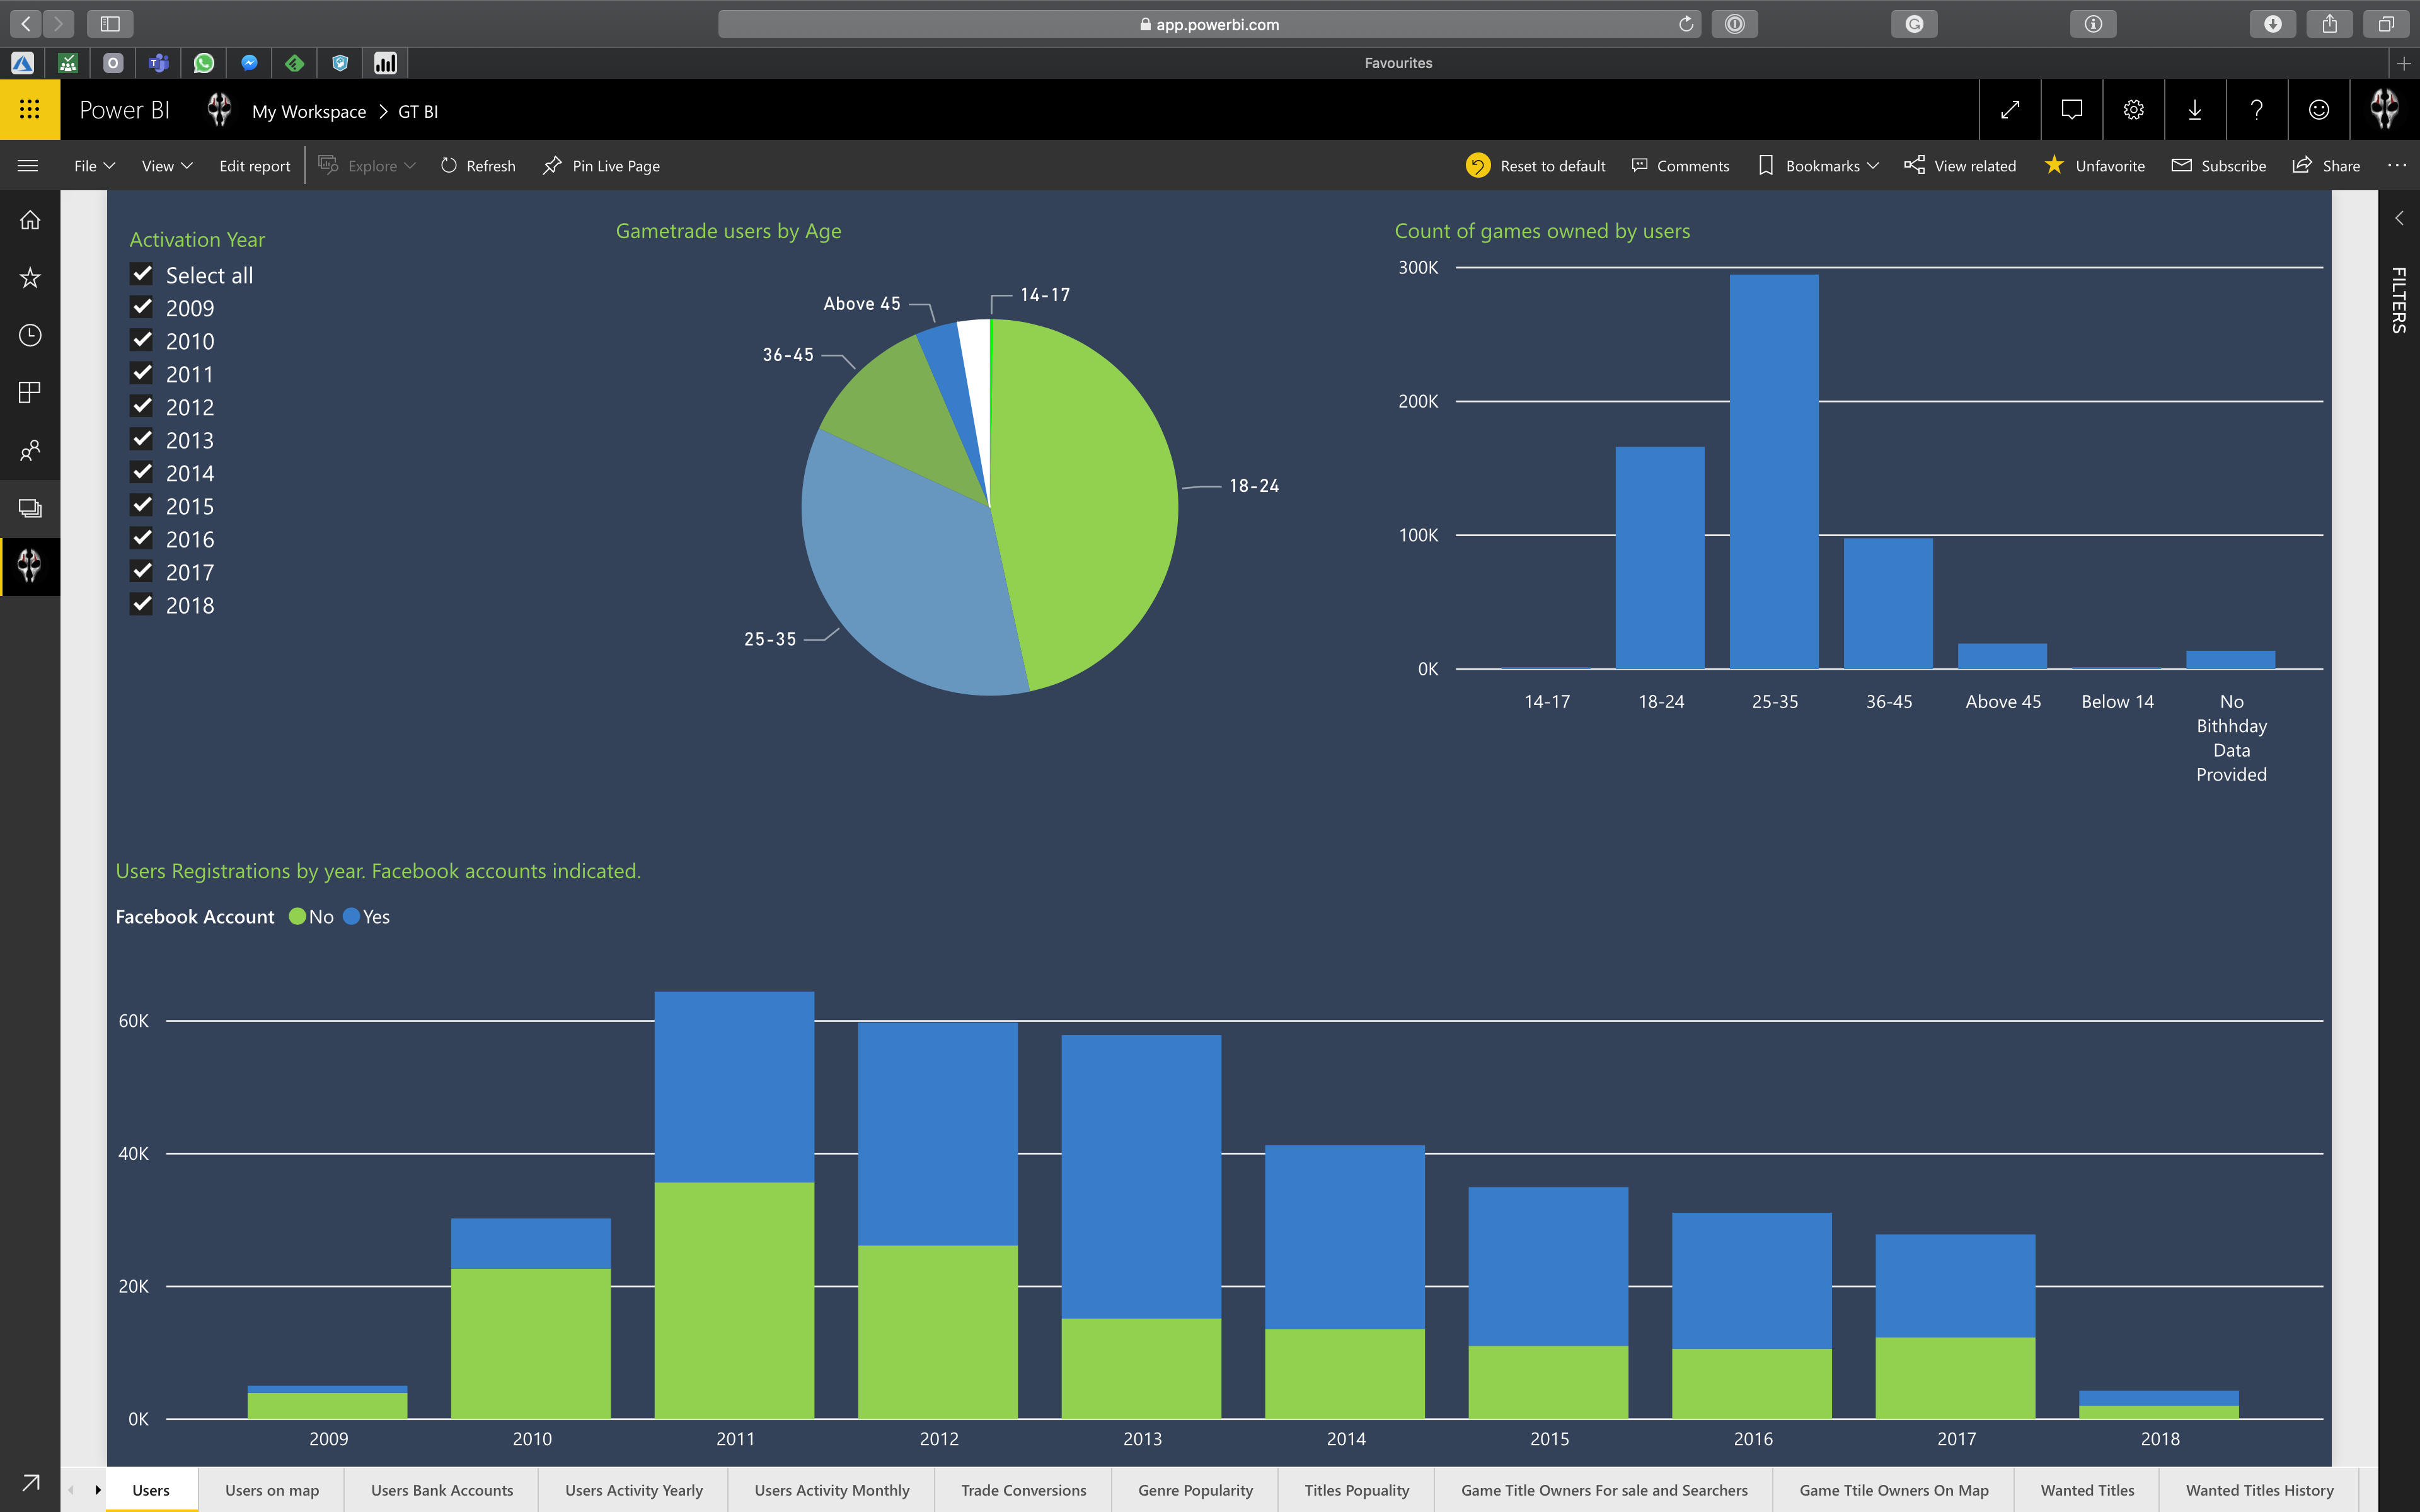
A report prepared in Power BI summarizing users in terms of age and the number of games they have.
Power BI Dashboard
interactive visualization of registration in the portal with segmentation according to the age of users
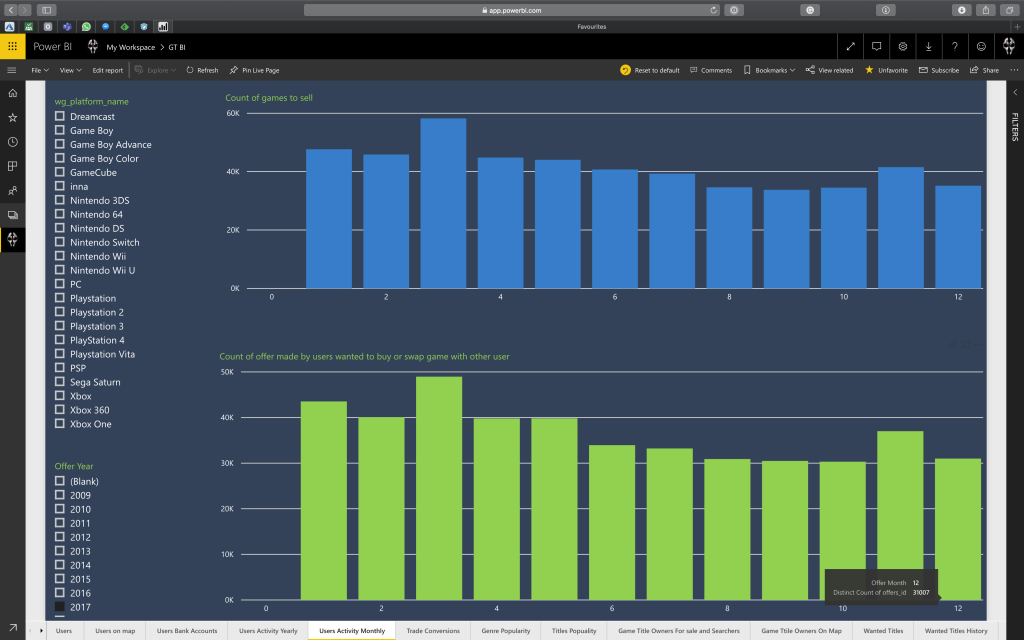
Visualization of user activity with an indication of the number of offers sent
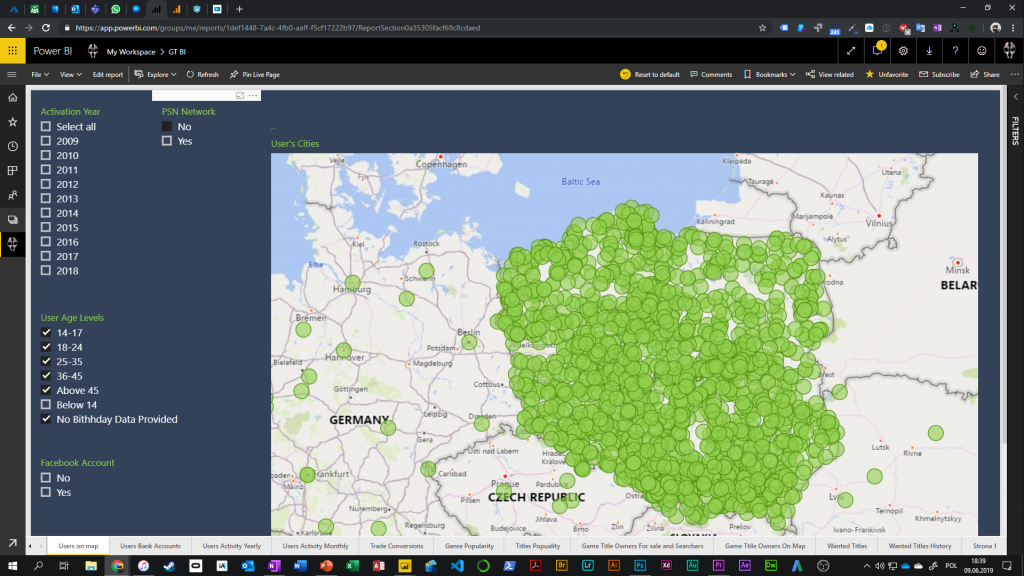
A simple visualization of the geolocation of owners of specific game titles on the map.

Visualization of users on the map with the possibility of segmentation of:
- Year of registration
- Facebook account
- Age range
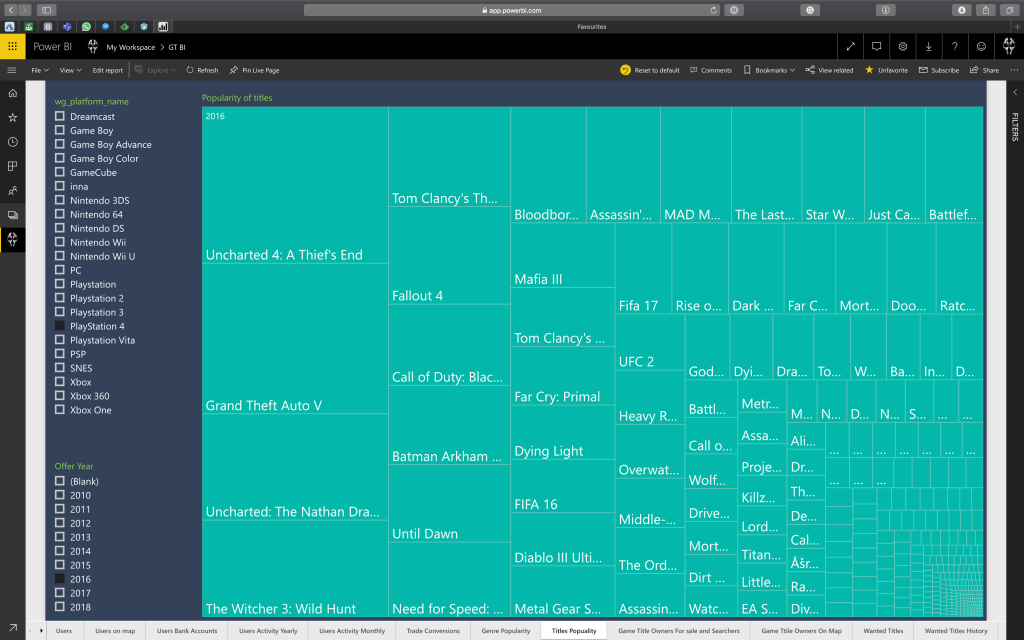
Analysis of the effectiveness of the posted offers of users according to the gaming platform

Visualization of the most popular game titles by platform and year of the analyzed year