Polski
Project description
Service 1
focused on Eco Driving through a mobile application by learning eco-driving style using the mobile application.
- automatic recording of refueling history,
- car mileage and gas station geolocation data,
- monitoring and history of fuel combustion,
- analysis of the quality of the fueled fuel,
- determination of the real amount of refueled fuel by OBD,
- social networking site,
- offering the possibility of sharing data,
- rankings and badges like FourSquare and Endomondo,
- recommendation of the best eco-driving routes
Service 2
Analysis of the monitoring of car comupter services directly in the smartphone through:
- monitors the interpretation of data errors from the Engine Computer unit,
- alarms about events such as battery discharge using external data, including weather forecast and GPS data,
- on the basis of data obtained from the expert system of car model identification after the VIN number,
- sending information about potential faults and the best methods to avoid them,
- reporting on improper use of the car.
Service 3
Electronic vehicle card – a service related to recording the history of the car’s operation, including: driving style characteristics as an online car profile, which could be used, for example, when selling a car as a proof of the correct driving style.
.
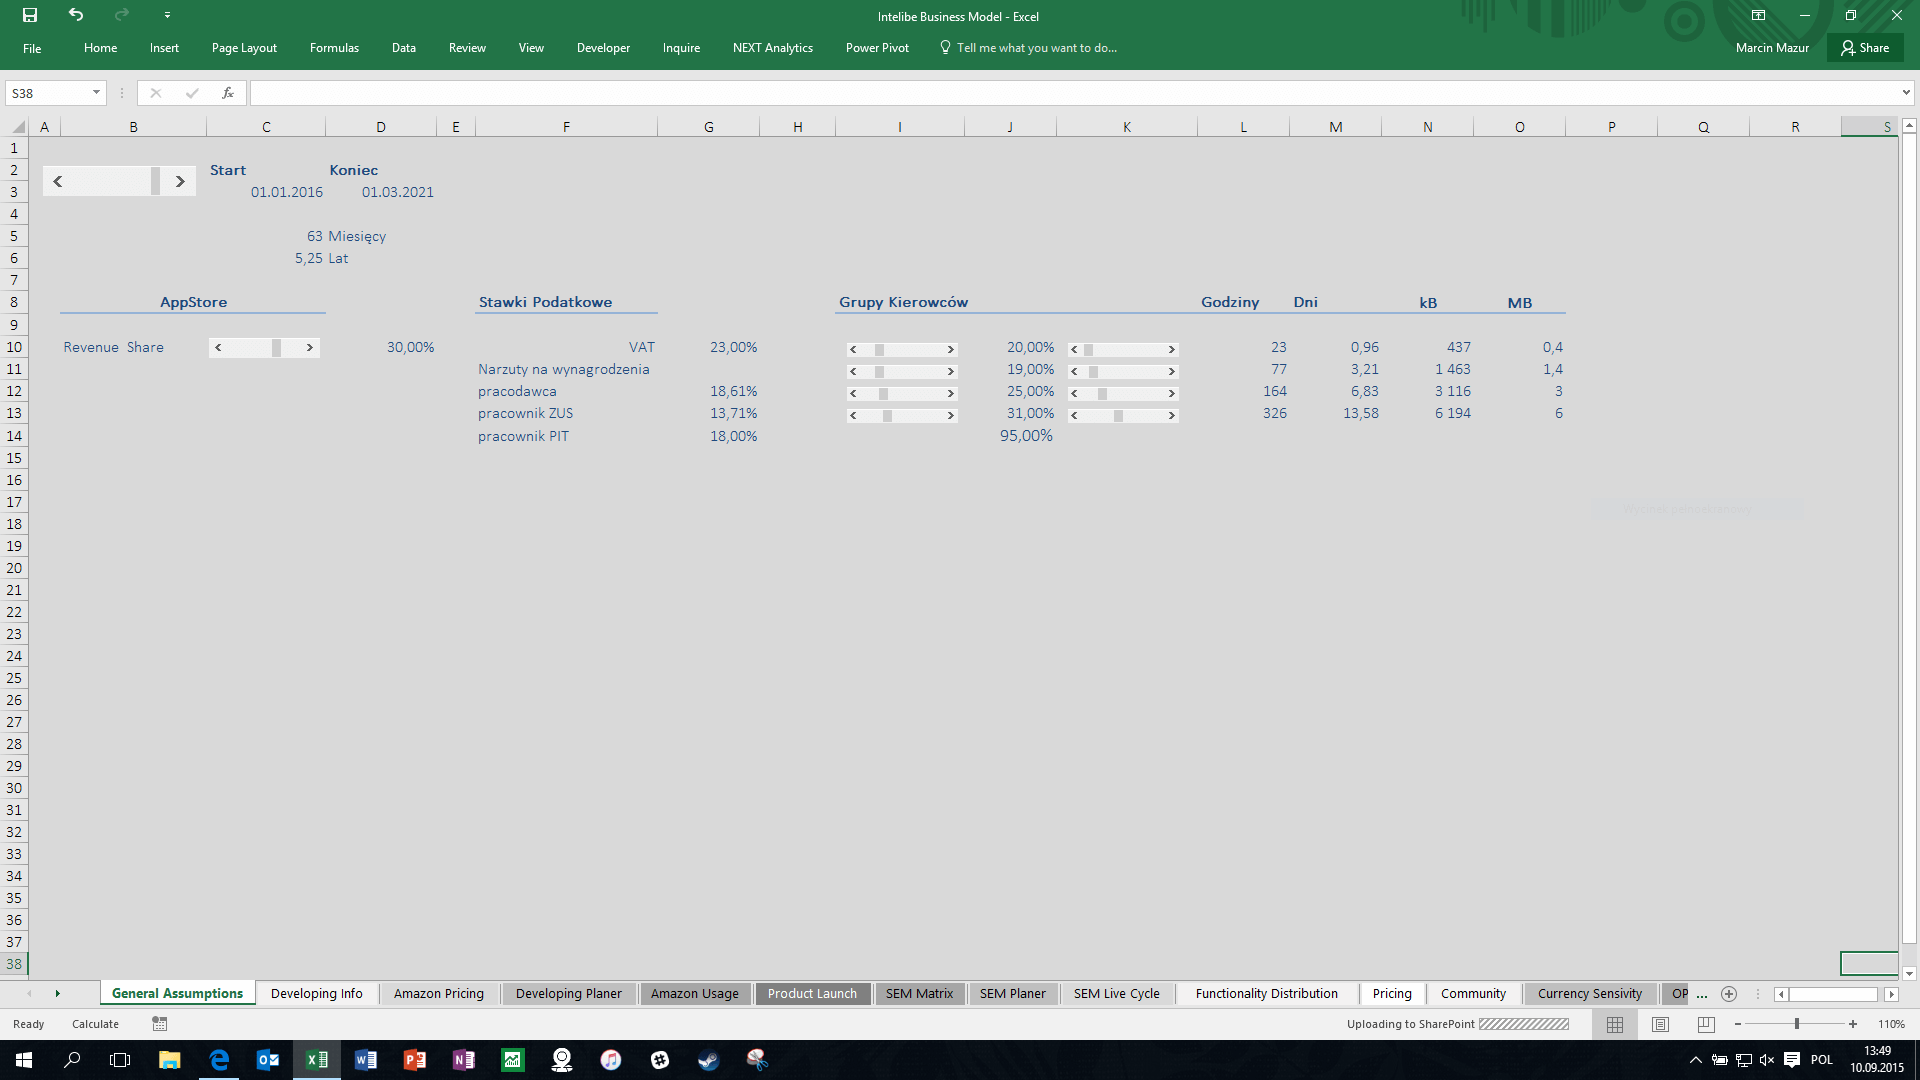
General data of the financial model
The initial part of the financial forecasts made via Excel. This section provides basic information
business plan in the form of rates:
• tax,
• labor costs,
• revenue share settlements,
• statistical data.
The effective date of the financial forecasts.
The basic part of financial forecasts created in Excel. It contains general data in the form of tax rates, labor costs and the project launch date.
Each change of date updates the balance sheet, profit and loss account and cash flow.
Każda zmiana daty aktualizuje bilans, rachunek zysków i strat oraz cash flow.
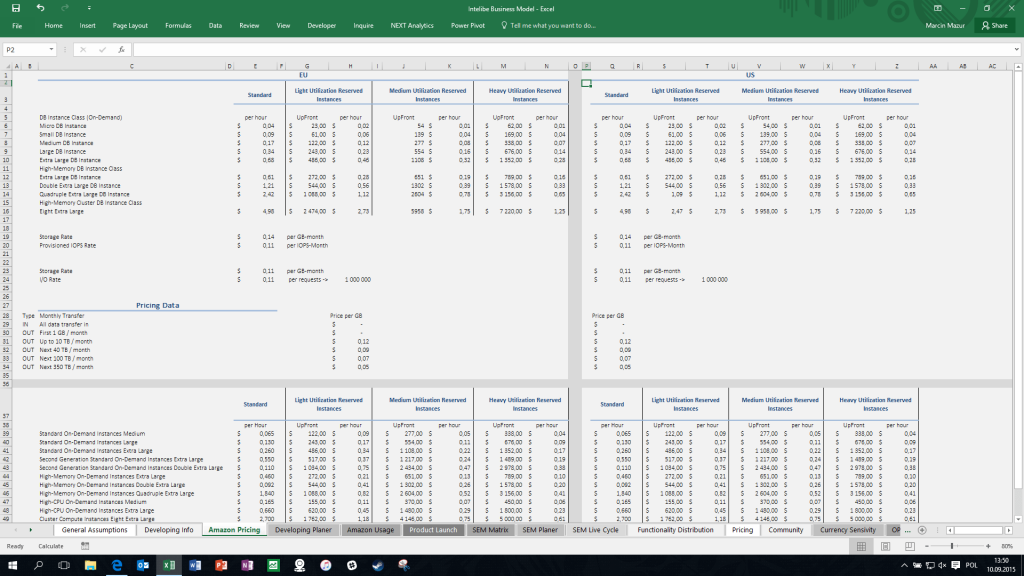
Prices – cloud services
The spreadsheet is available in the business plan itself and in the financial model. The prices of cloud computing services offered by Amazon at that time were listed.
The introduced prices were in line with the Amazon AWS price list in force at that time.
The spreadsheet uses this data to calculate the cost of the entire infrastructure by collocation location.
Milestones
In Excel, one of the sheets was devoted to describing the individual milestones of the project implementation.
The individual application modules, constituting milestones in the solution preparation process, have been listed.
The schedule and cost estimate of each of these elements is presented further in the financial model.

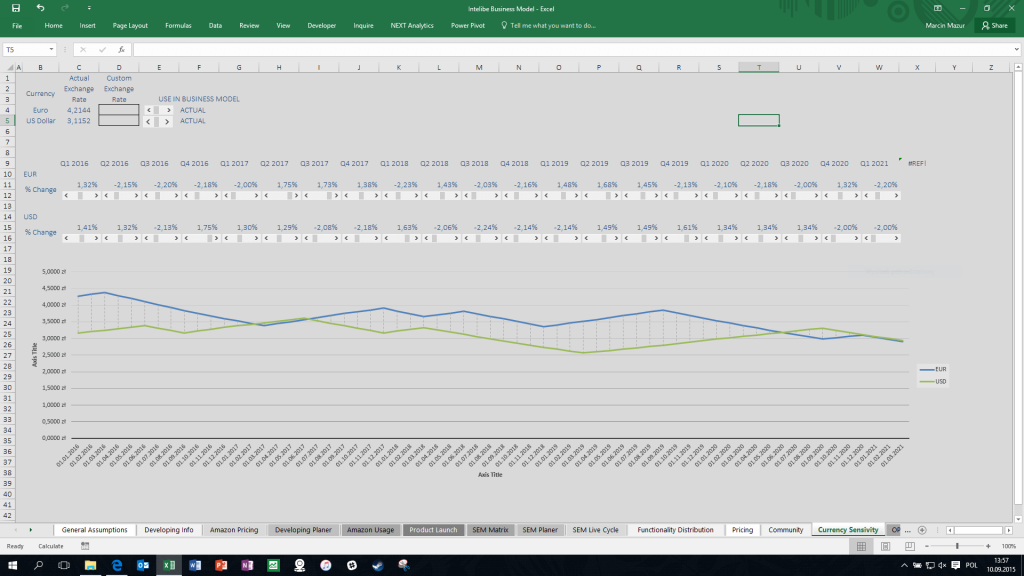
Analysis of the impact of changes in exchange rates
When creating the business plan and financial forecasts, it was necessary to take into account the possibility of verifying the model in terms of exchange rate fluctuations, because some of the revenues and costs were to be in EUR and USD.
Excel allows you to define your own values of initial rates or download the current rates from the NBP website. Then, thanks to the use of VBA, the analyst can introduce changes in rates and observe dynamic changes on the dashboard on an annual or quarterly basis.
Each change has an impact on key business plan factors such as:
- income,
- costs,
- EBIT,
- EBITDA,
- net profit or IRR.
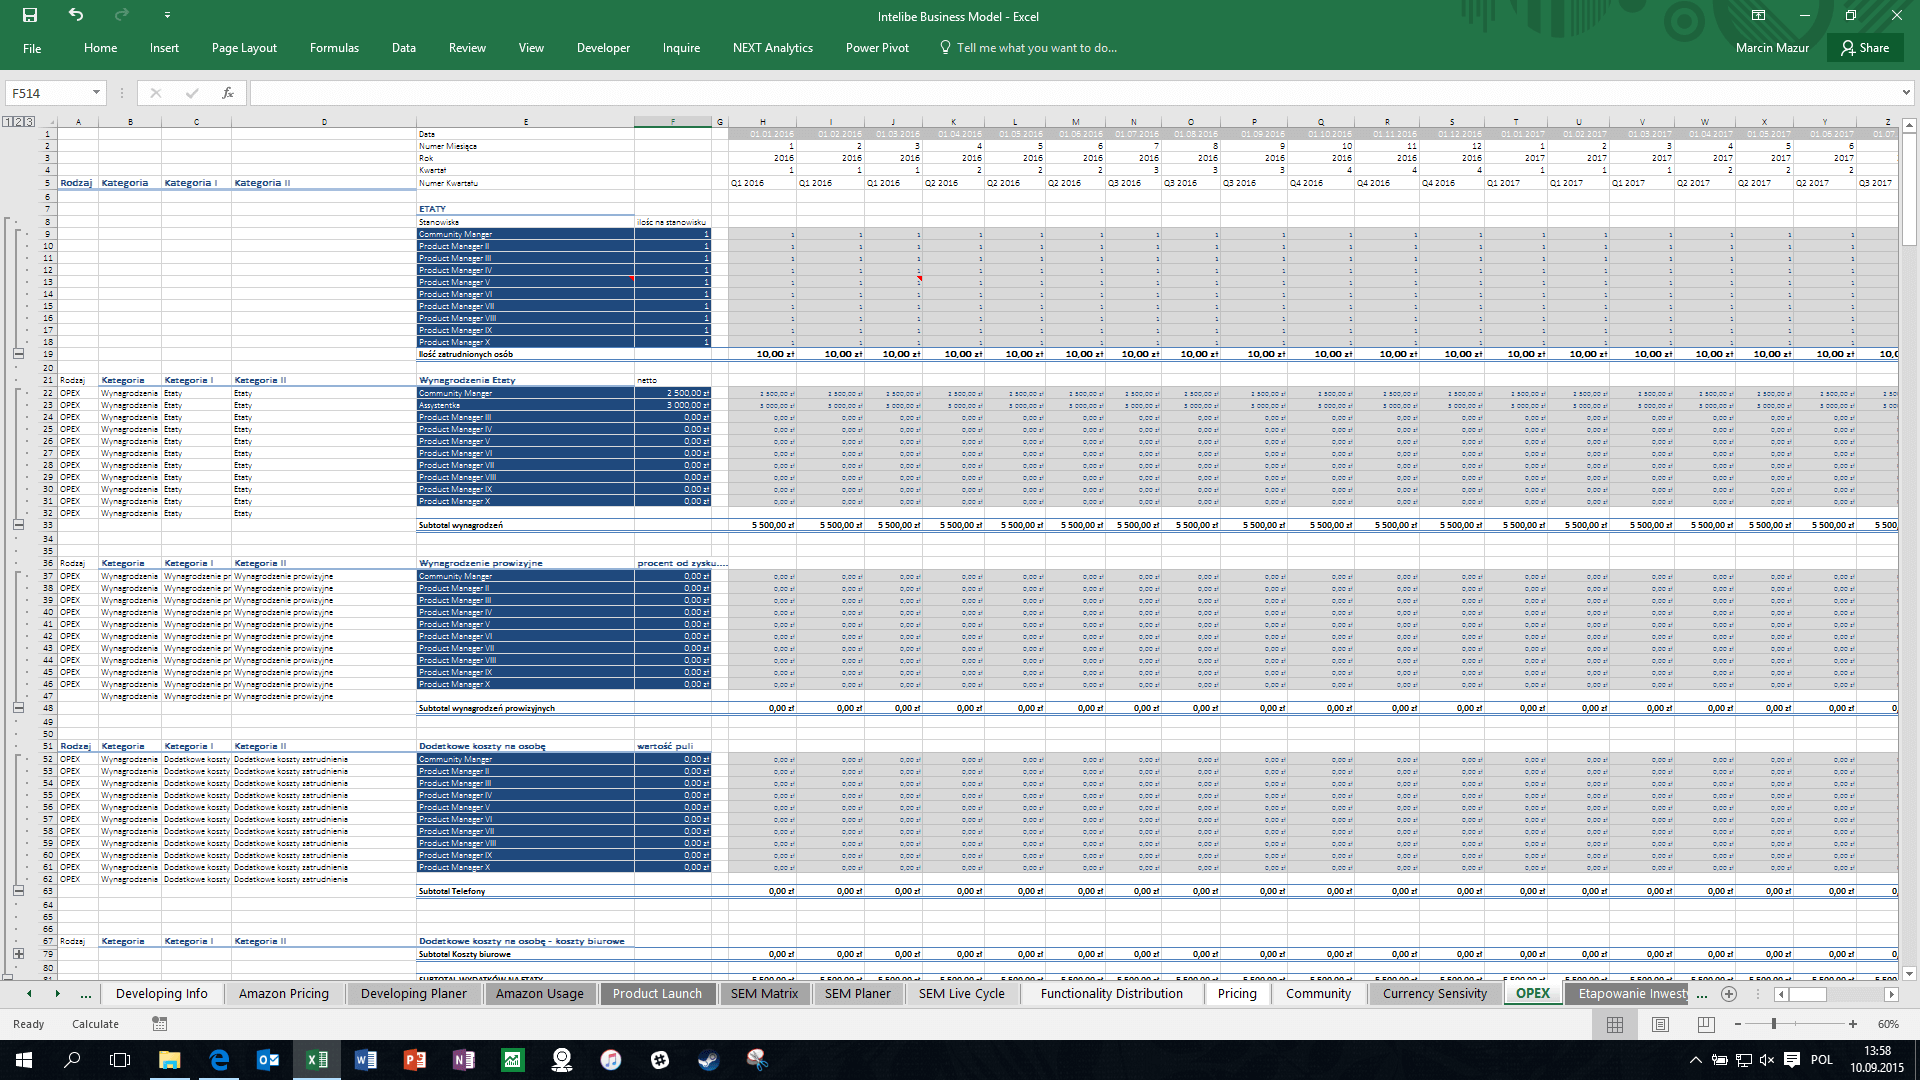
OPEX cost statement
OPEX cost statement
Cost statement – a standard element of any business plan. Such a sheet functions independently in the company as the so-called “budget”.
This worksheet is divided into two sections. One is updated by a business analyst or project manager who must complete cost data in the form of:
- the number of jobs with the described position and remuneration,
- number of contracts for specific work with the amount,
- the quantity and cost of any outsourcing services.
Costs related to project marketing and development are updated through dedicated Excel sections for the sake of comfort, greater precision and better data visualization.
Infrastructure operating costs are calculated using Excel formulas, due to their correlation with the growth of application users, which directly translates into the demand for data transfer, database server resources, etc.
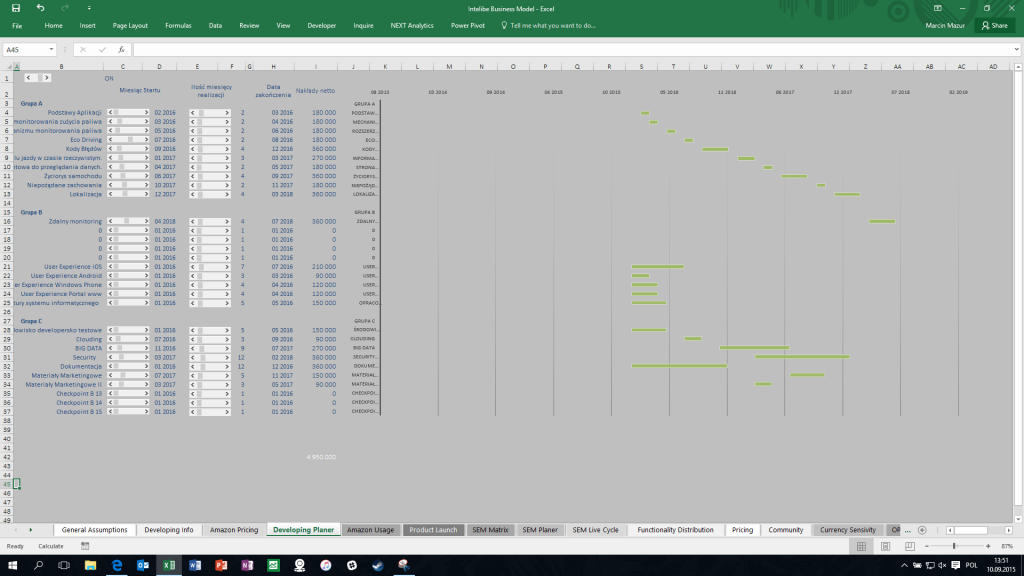
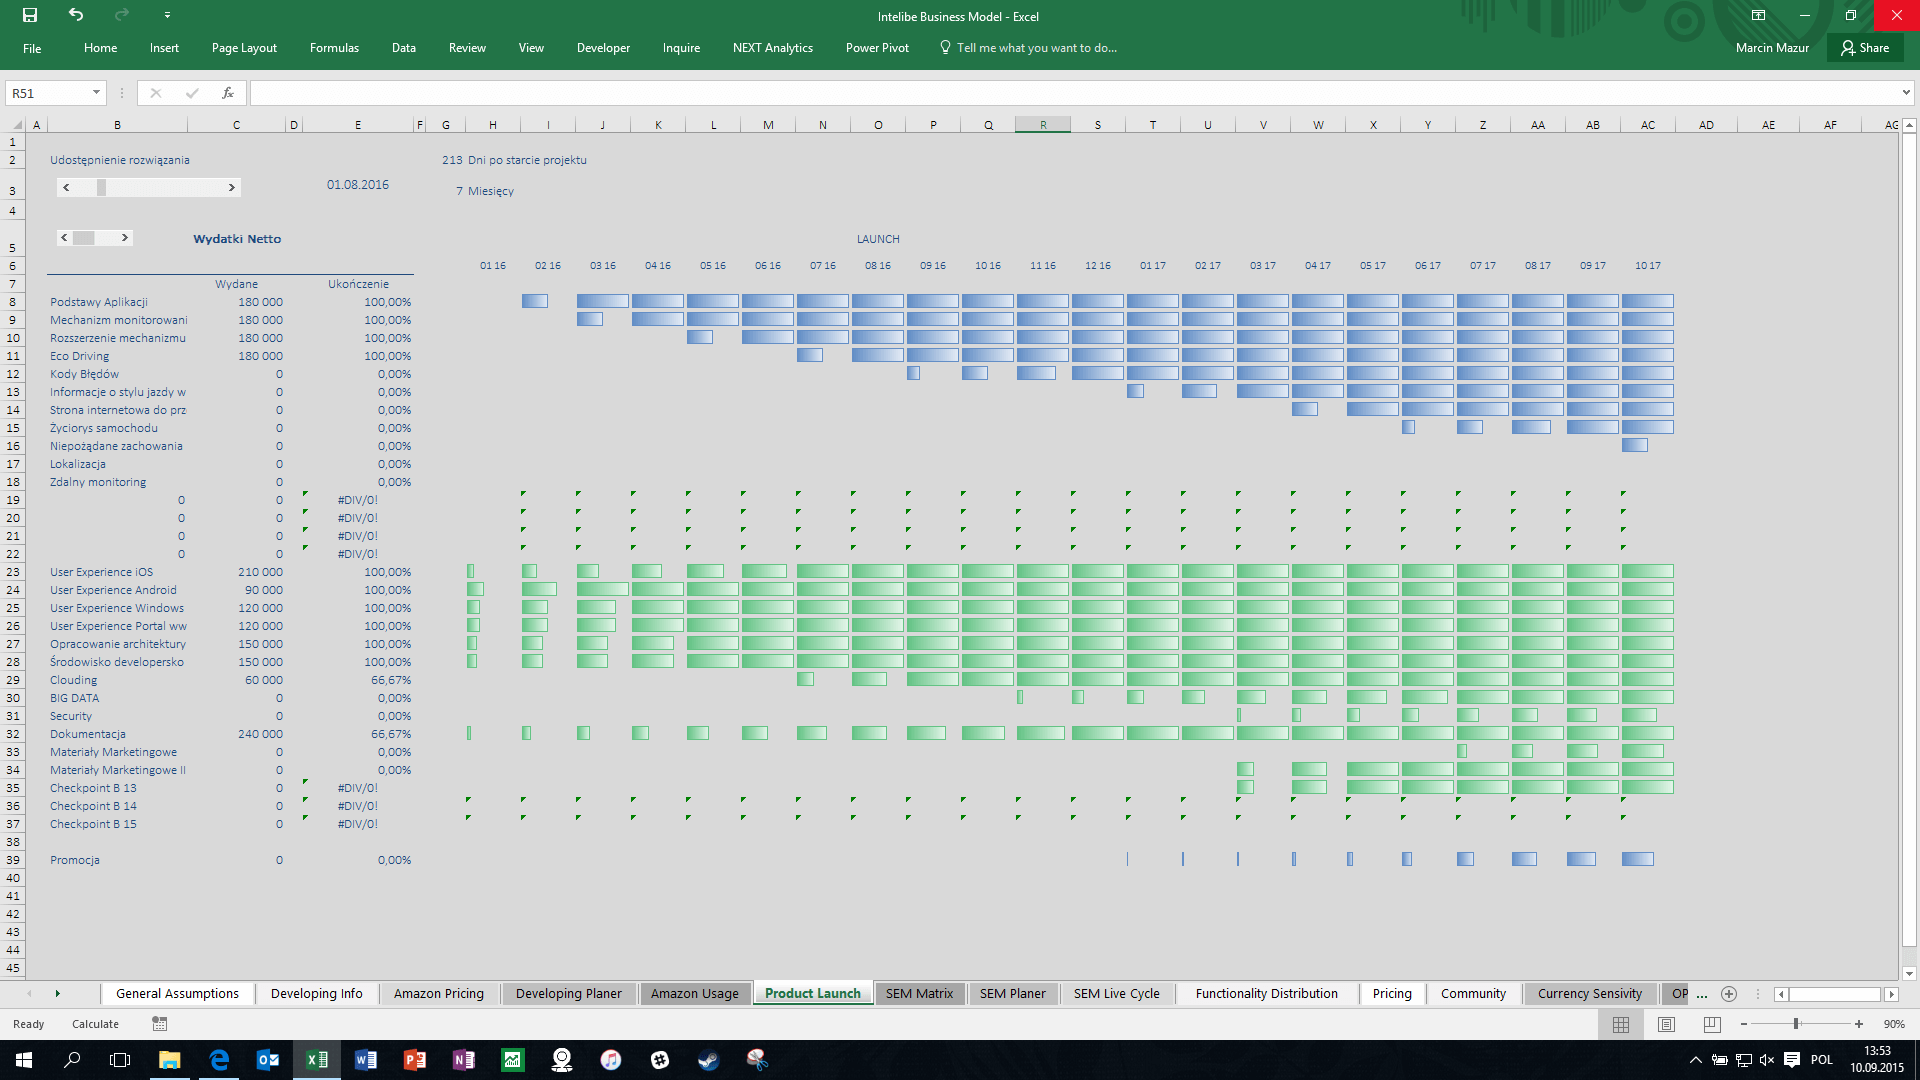
Application development implementation parameters
he schedule and cost estimate of the development work of the mobile application project using the Gantt chart, w
for more convenient planning.
Each stage is marked by:
- indication of the months in which the work is to start,
- how much time the stage is to be run.
Excel also shows the net / gross cost calculation of each step.
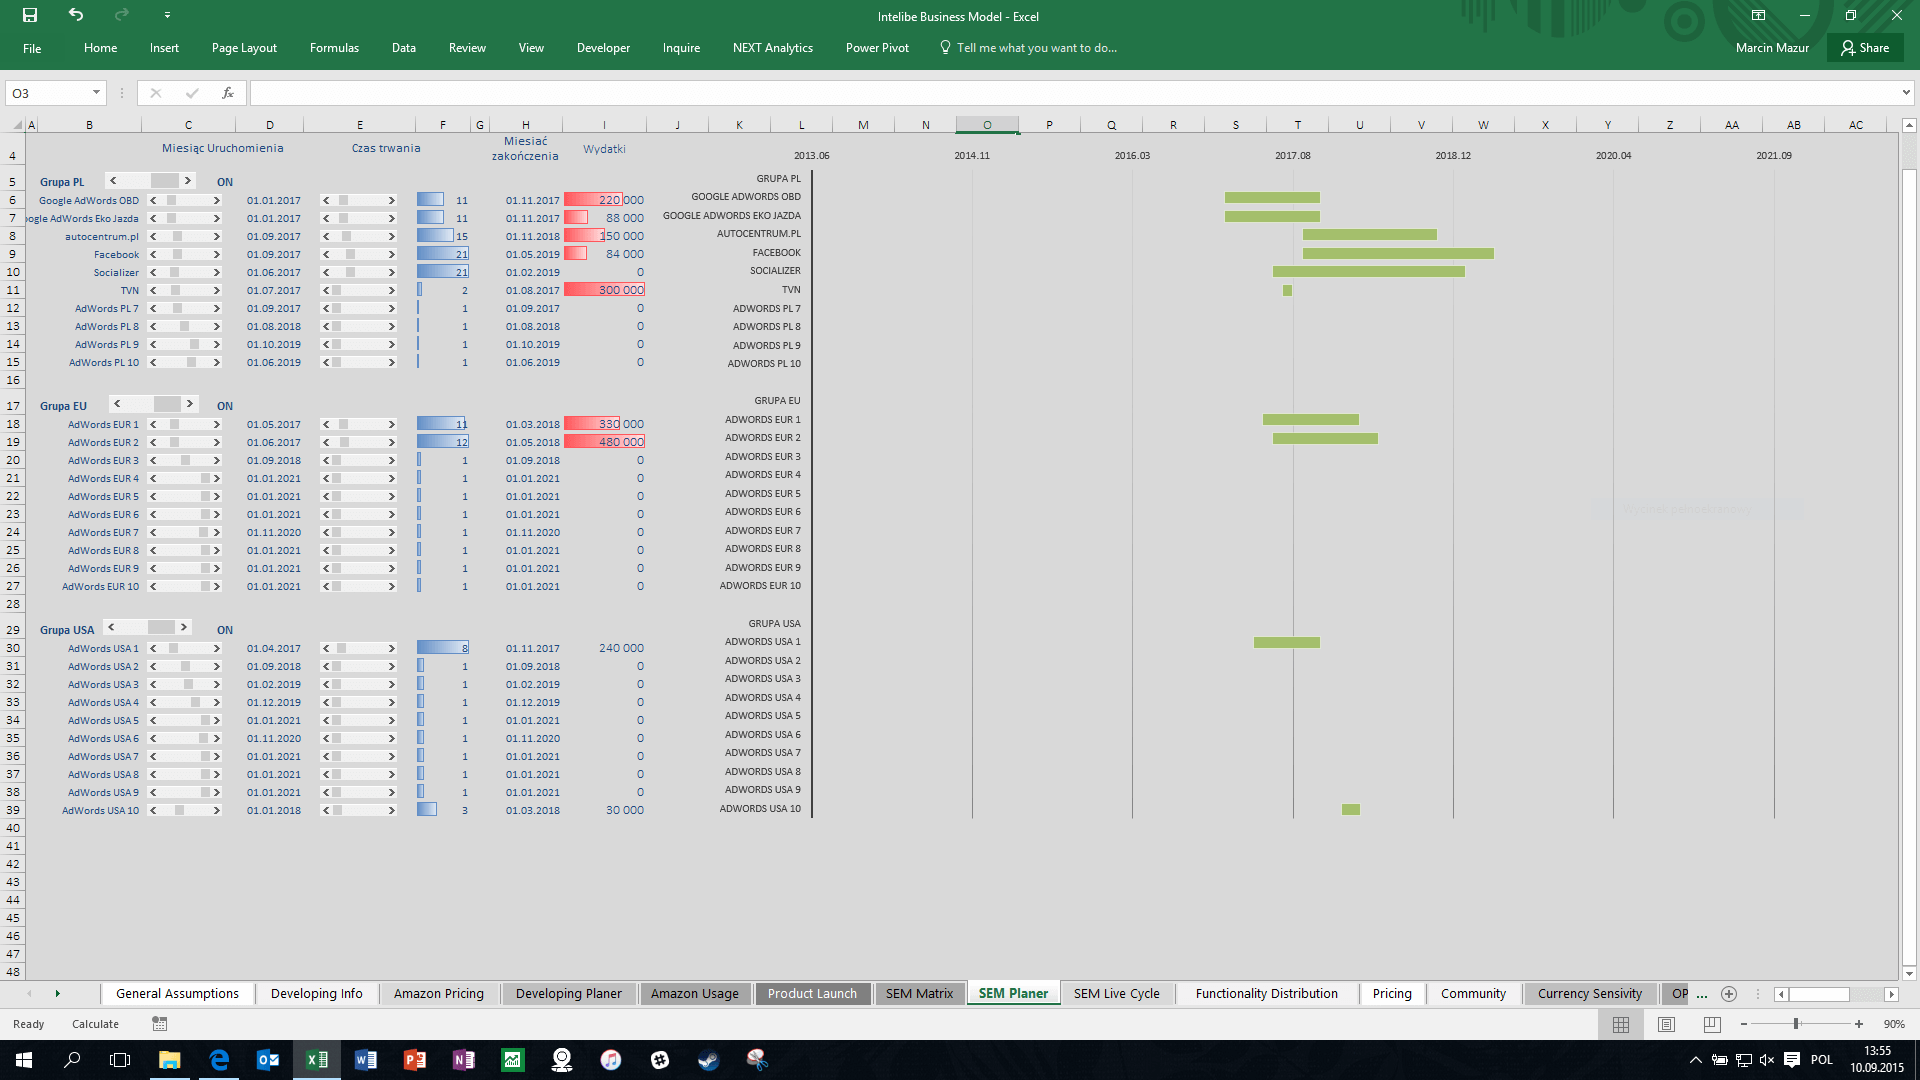
Planning of marketing expenses
The Gant chart is good for planning your marketing campaigns. This sheet contains the entire plan for the project, the data is completed by indicating the month and duration of the promotion.
Excel formulas are complemented by the cost data of the business plan and data on obtaining traffic to the website promoting the service.
The regional division has been preserved.
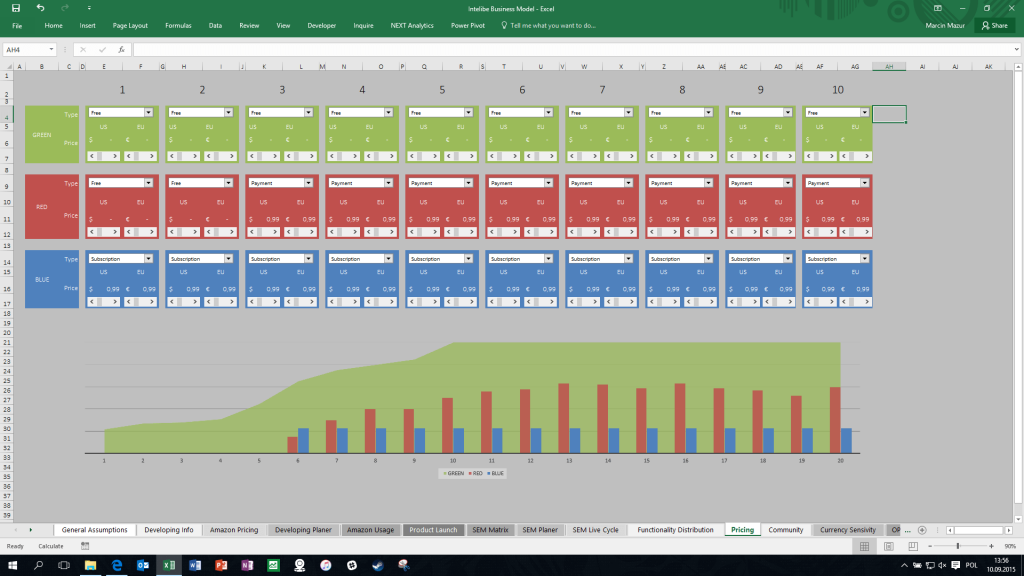
Pricing
A sheet devoted to defining the price list of services offered as part of the mobile application.
You can assign the following payment models to three services within 10 months from the date of commercial launch:
- subscription,
- one time payment,
- free service
Special Excel formulas recalculated the whole accordingly, taking into account payment models for people who made a one-time purchase or subscription.
During this period, it is also possible to change the fee rate with a distinction between the American and European AppStore markets.
MVP
Specifying a commercial launch date is an important part of any business plan. Excel supports by visualizing the status of development works.
Additionally, the calculation of the expenditure incurred at the moment of indicating the MVP is visible.
When selecting the launch date, excel recognizes it as the period in which the ad should generate application downloads, in addition, formulas related to sales funnel modeling marked as conversion trends begin to work.
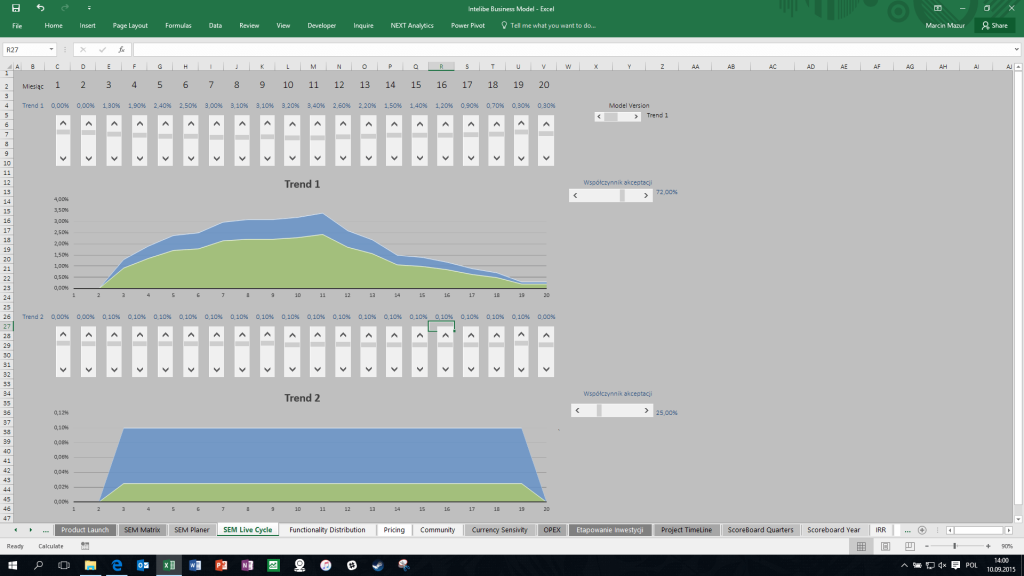
Conversion trends
In this Excel, it is possible to create and model two conversion trends.
This was to quickly analyze the impact of individual trends on the project.
The trends are visualized on charts, the values are determined for individual months with the possibility of forecasting for a period of 20 months.
Functionality distribution
The project assumed providing users with three basic functionalities within one installation of the mobile application.
At this stage of the business plan, you can simulate the distribution of interest in individual services.
The impact of changes in the form of changes in costs and revenues is visible on the dashboard and sheets devoted to the obtained accounting data.

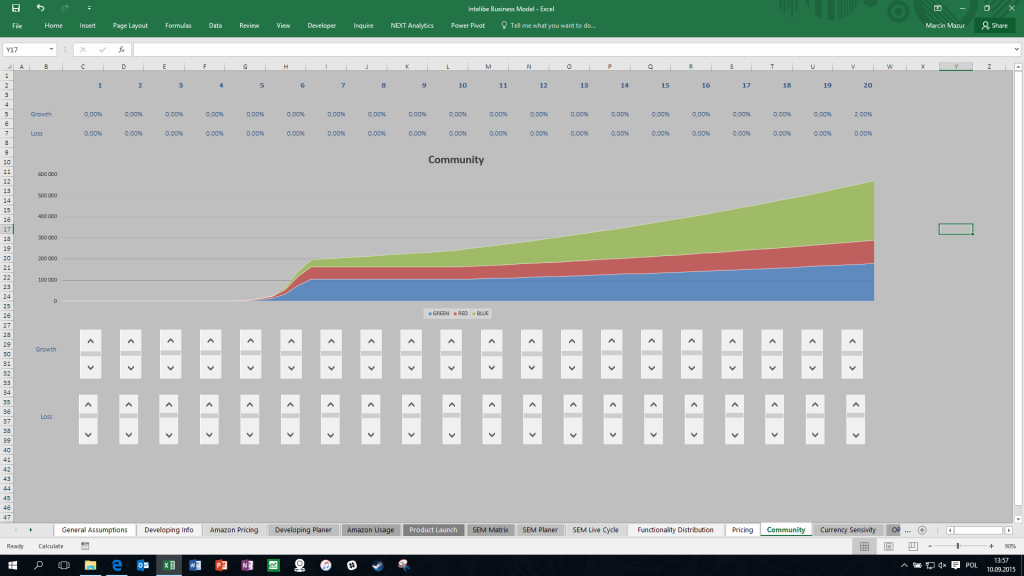
Community
At some point in every internet venture there is a phenomenon of natural acquisition of new customers as their loss.
Project Manager has the ability to make forecasts for expected trends.
In this sheet, you can also include the planned effects of internal marketing activities.
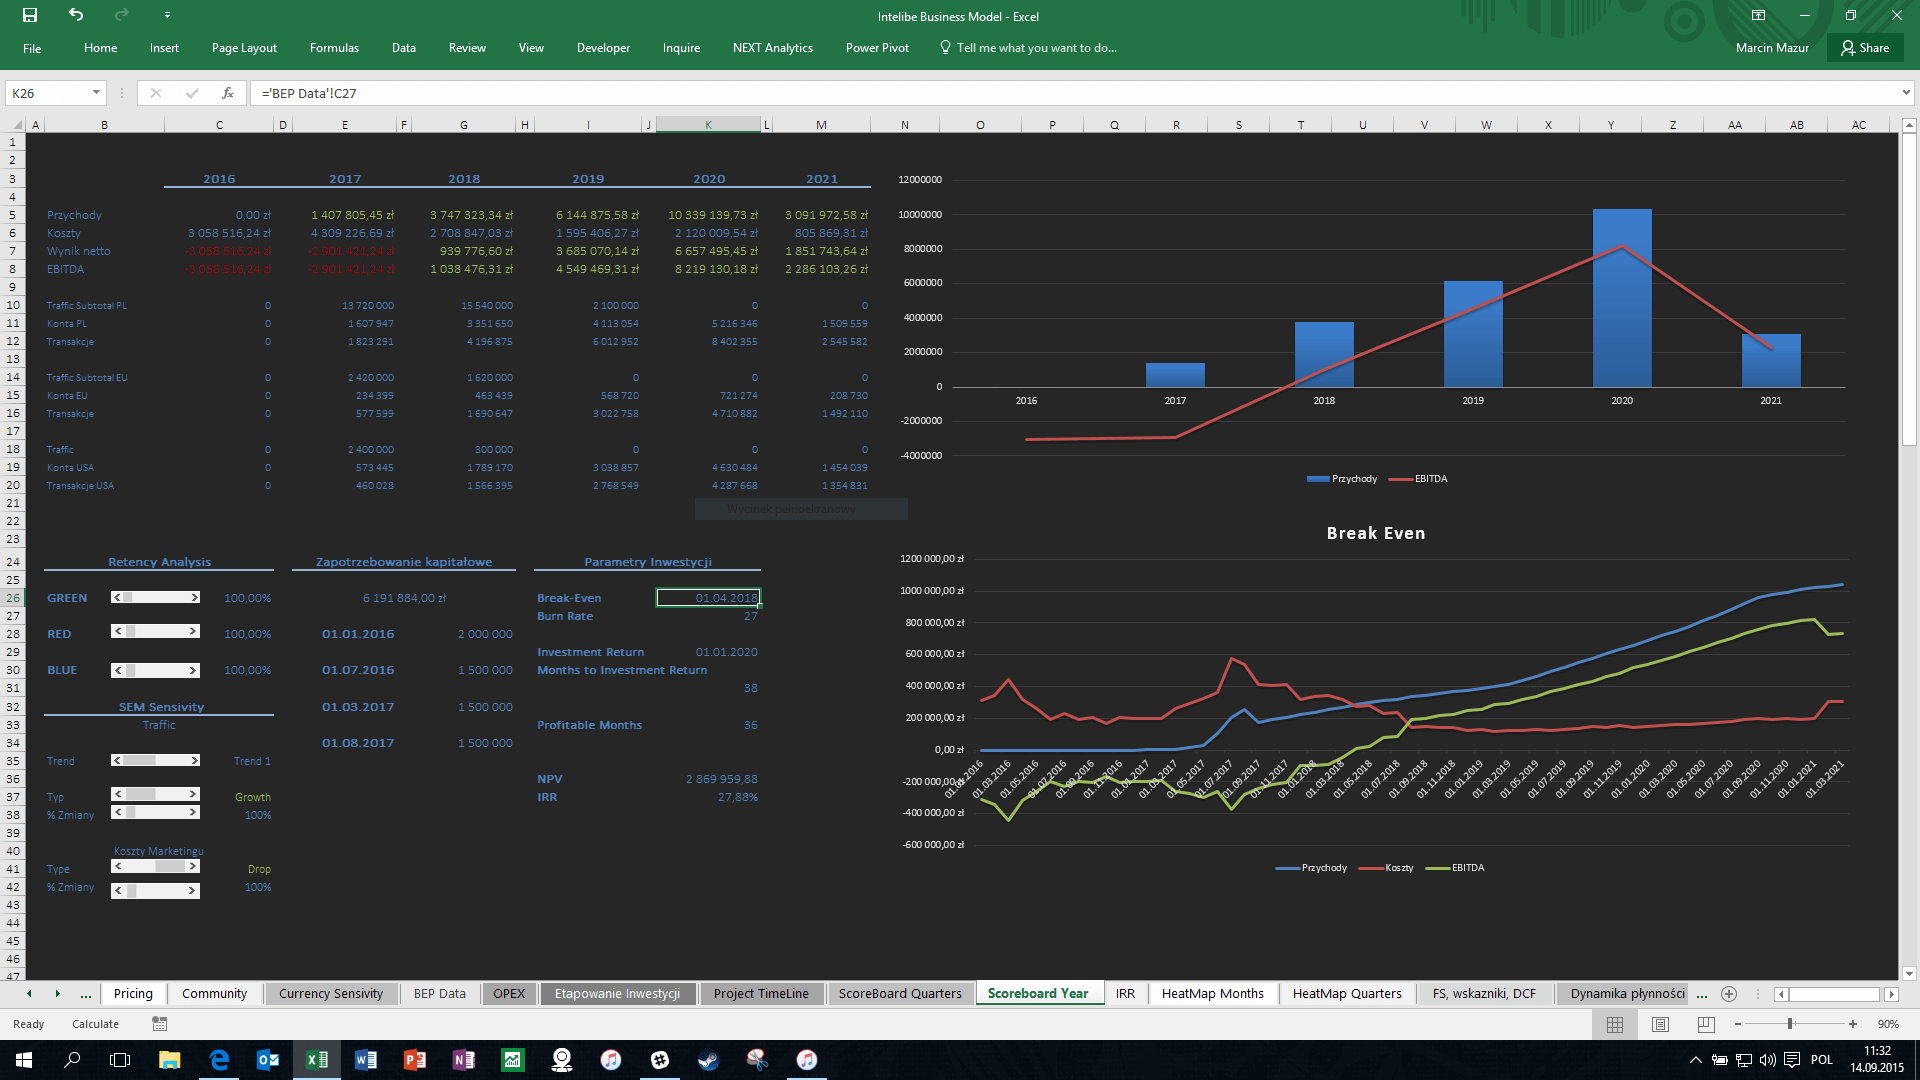
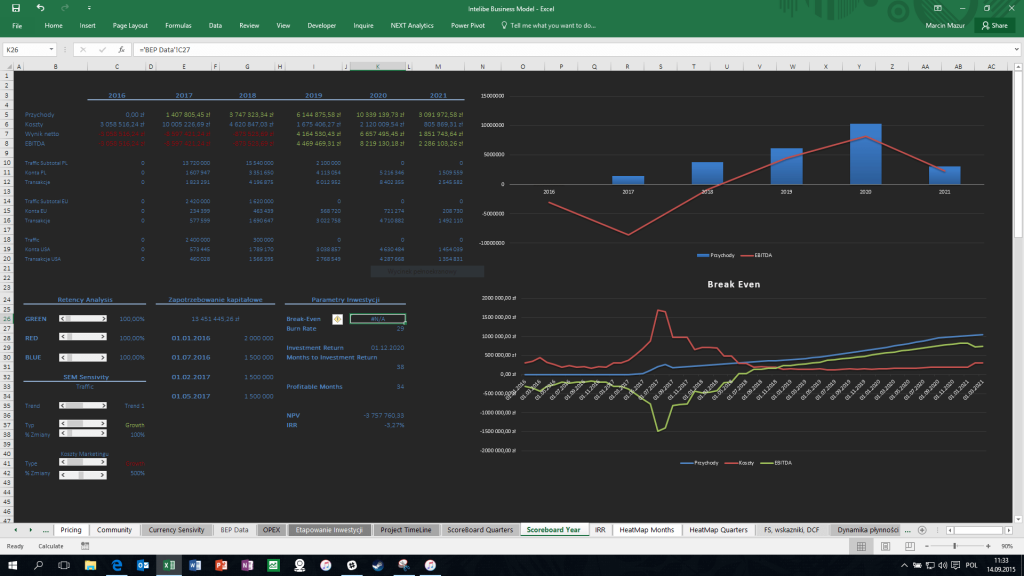
Financial Modeling
The prepared financial model is summarized in the so-called managerial desktop. This spreadsheet provides an annual overview containing basic data such as:
- project revenues,
- costs,
- EBITDA,
- Traffic to websites generated by marketing activities divided into regions,
- visualization of revenues and costs in the form of a graph,
- visualization of the break even point on the graph,
- BEP dates and return on investment,
- the so-called burn rate,
- NPV and IRR values
- the volume of capital requirement along with the dates on which the capital increase would take place.
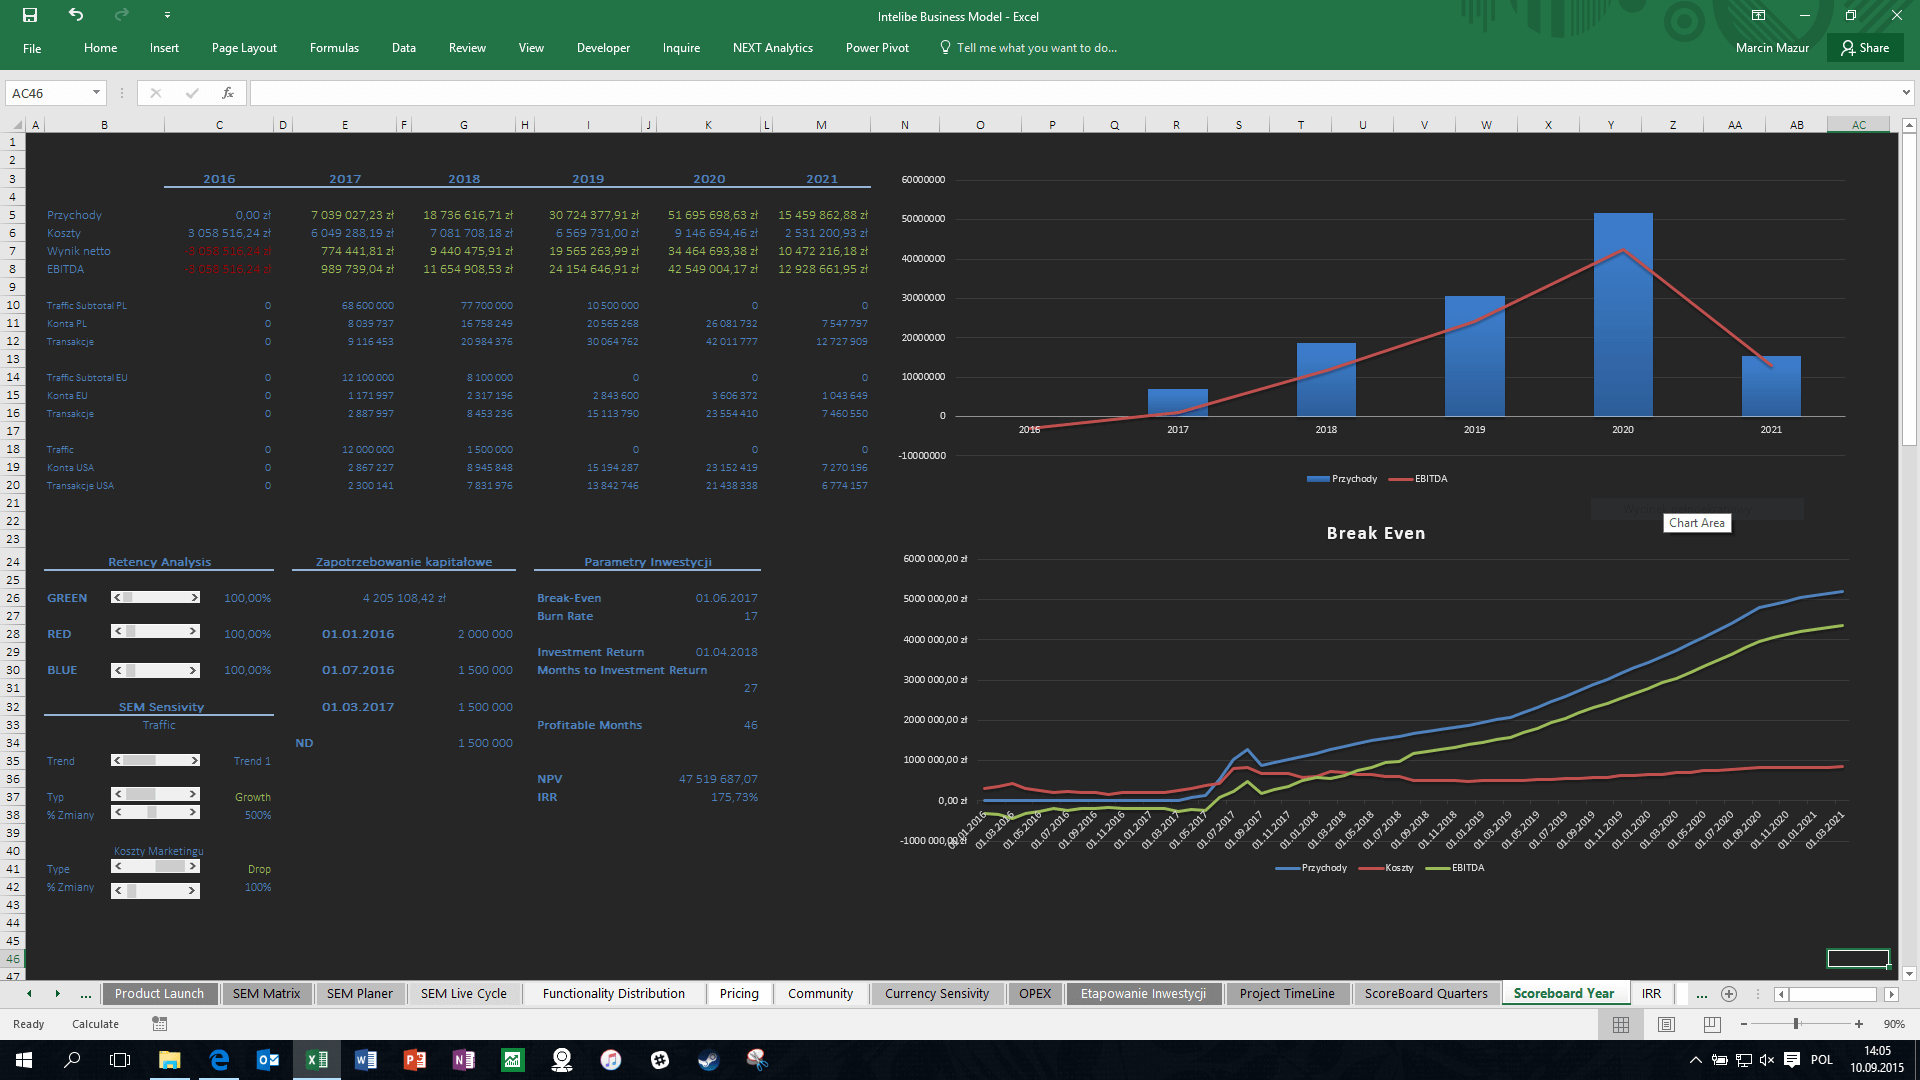
Financial Modeling – variant 2
The possibility of conducting business simulations by simply introducing changes to the model has been made available.
You can modify the following factors:
retention in individual services,
change of the conversion trend from variant 1 to variant 2,
simulation of growth under the decrease in advertising costs,
the effects of increasing or decreasing the effectiveness of advertising.
To improve the functionality, the available VBA macros were used
in Excel.
Financial Modeling – variant 3
This simulation shows a scenario in which advertising costs will decrease and advertising effectiveness will be greater.
The financial forecast automatically recalculates the entire model to the target
presenting new business parameters.
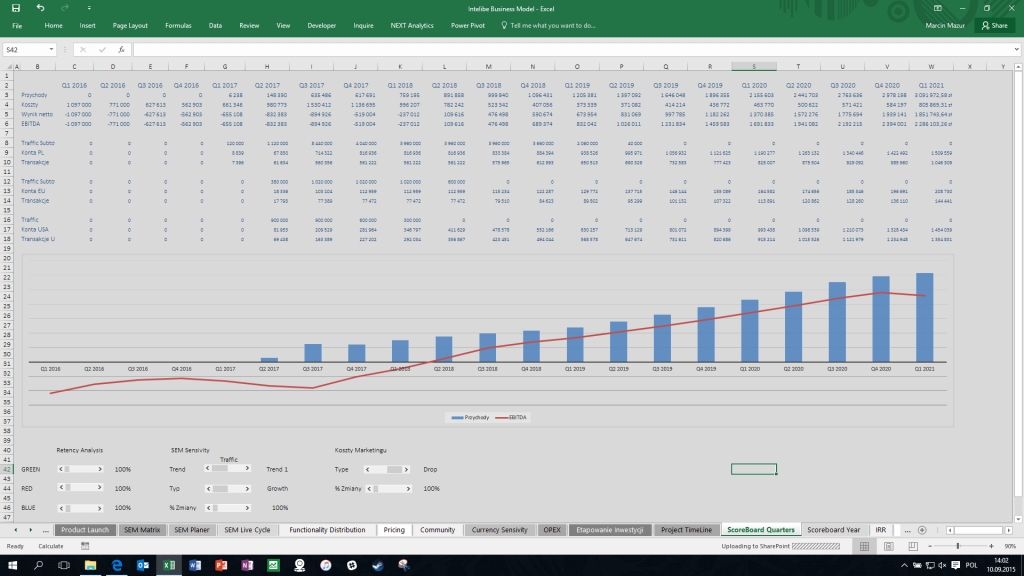
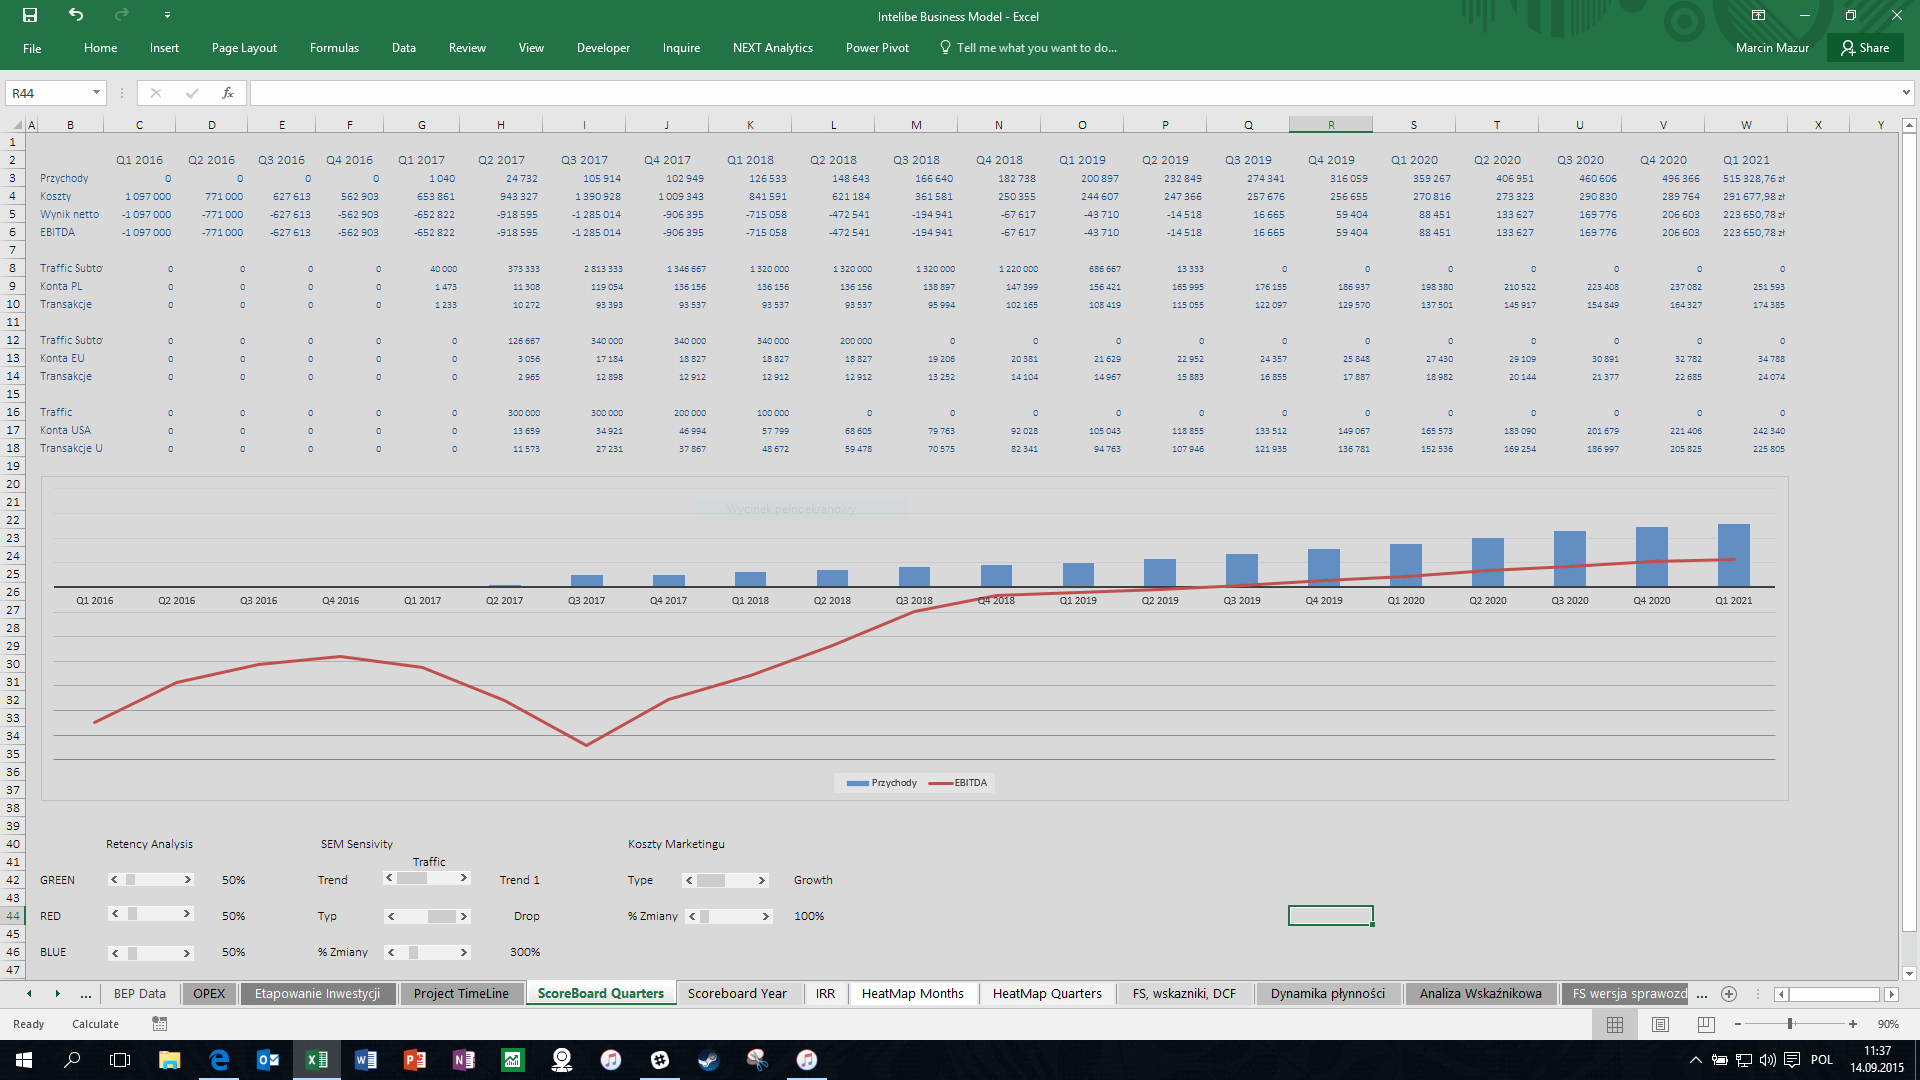
Financial Modeling – variant 4
An analogous dashboard has been prepared, however on a quarterly basis, which gives a better overview of the dynamics of the development of the investment project.
The chart shows the Revenue and EBITDA for 5 years in a quarterly breakdown.
As standard, the Chart shows the Break Even moment of the project.
Financial Modeling – variant 5
There is also the possibility of carrying out on the sheet there project analysis using basic factors. In this case, a different trend was used, which showed that it will not be possible to break even with the forecasted conversions.
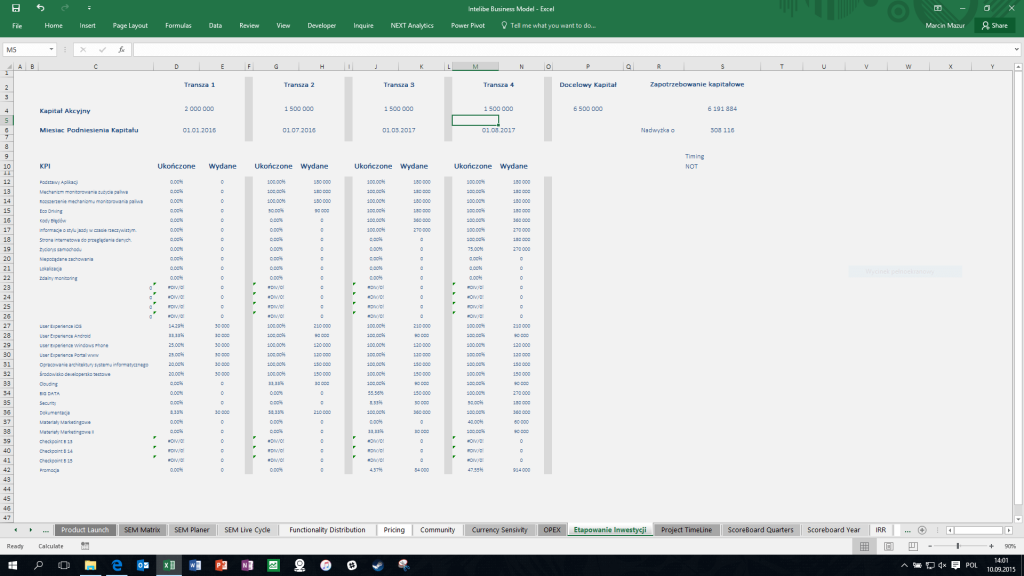
Staging of the investment
The worksheet shows the investment stage. Excel calculates specific dates in which months the company’s capital increase will have to take place. Excel also indicates as KPI the completion of individual project stages expressed as a percentage and the costs incurred (Spent) as at the forecast date of the capital requirement.
In this way, the data necessary for the investment agreement between the investor and the applicant were obtained. The capital demand and the planned surplus, i.e. the so-called financial reserve, were also determined.
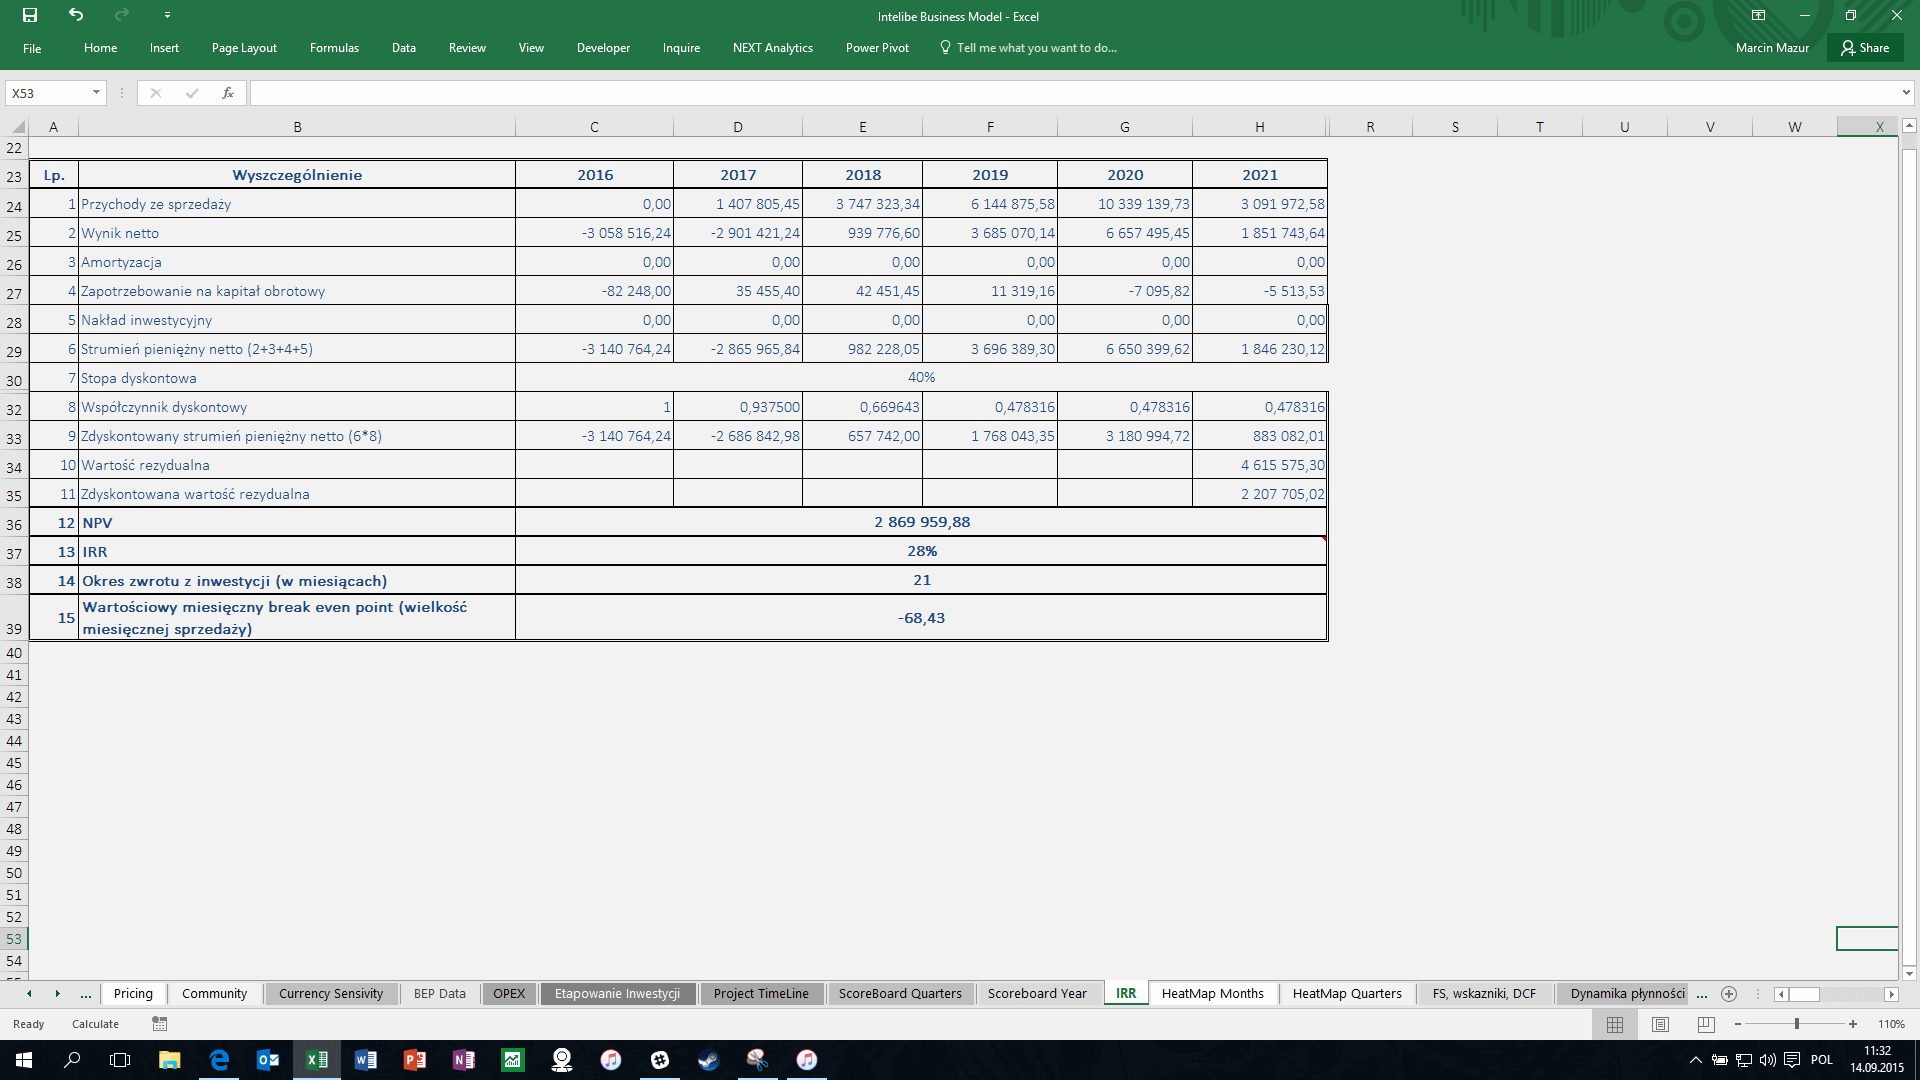
IRR and DCF Valuation
The value of the IRR ratio is one of the most important indicators for a potential investor. Any business plan
must include a calculation of the internal rate of return and NPV,
because they are crucial to your investment decision.
Each investment project includes such calculations.
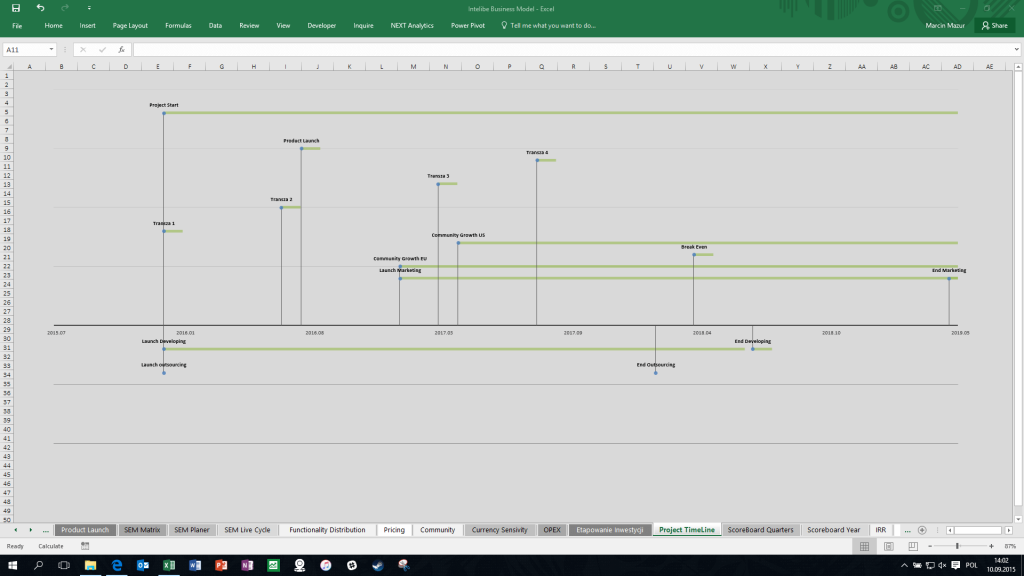
Project implementation on the timeline
The investment documentation required the visualization of the key elements of the project. A dynamic Gantt chart was used, which in an accessible way shows the schedule of the most important moments of the investment project implementation.
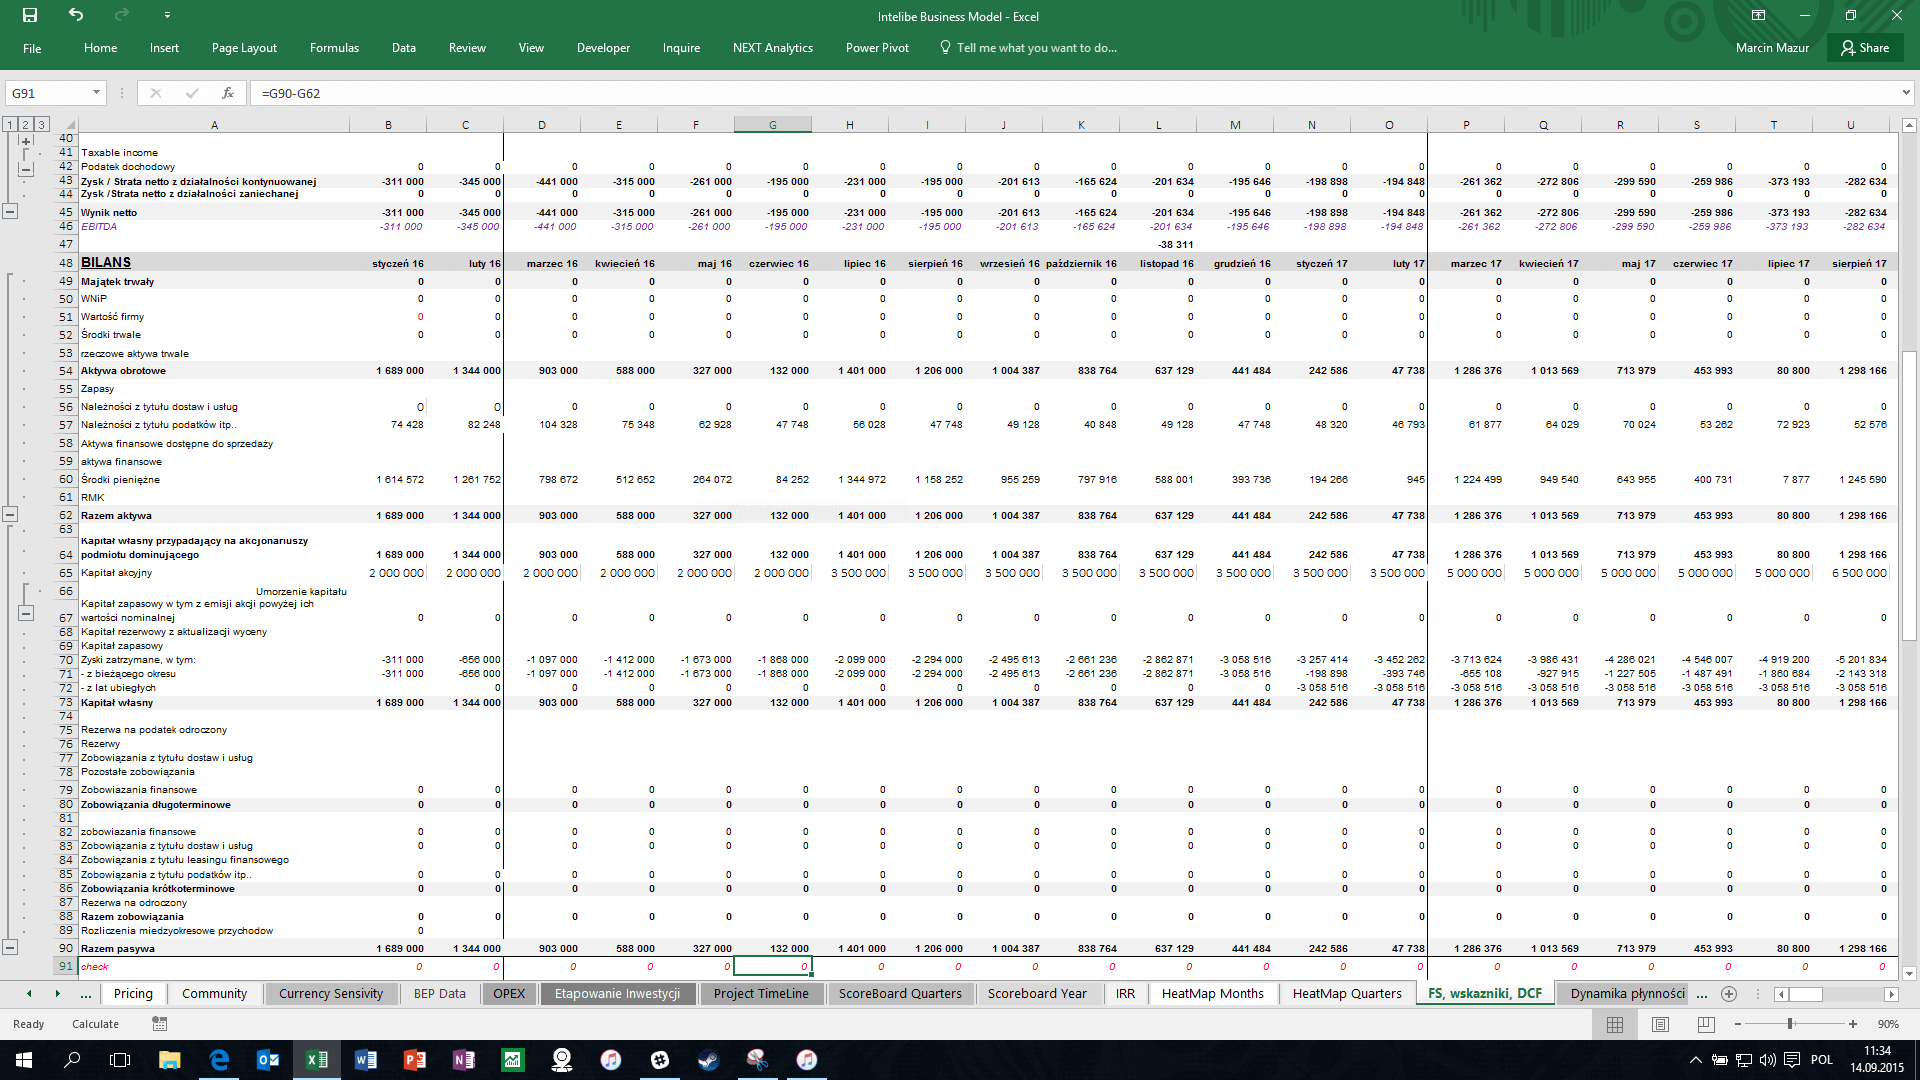
Balance sheet
The balance sheet is a key element of any business plan and investment project.
It contains a static picture of the situation of the property components of an investment project and their financing sources.
Assesses the property status taking into account the variables of the application.
Excel shows the balance forecast for the next five years of the operation of the venture. The spreadsheet was designed so that individual model changes were reflected in the balance sheet.
Each investment project includes such calculations.
Profit and loss account of the investment project
Another obligatory element of each project is the Profit and Loss Account. The model was designed to take into account all costs and revenues resulting from the mobile application, broken down by individual months.
The profit and loss account has been forecast for a period of 5 years.
Each change in the costs and revenues of the business plan is reflected in the designed Profit and Loss
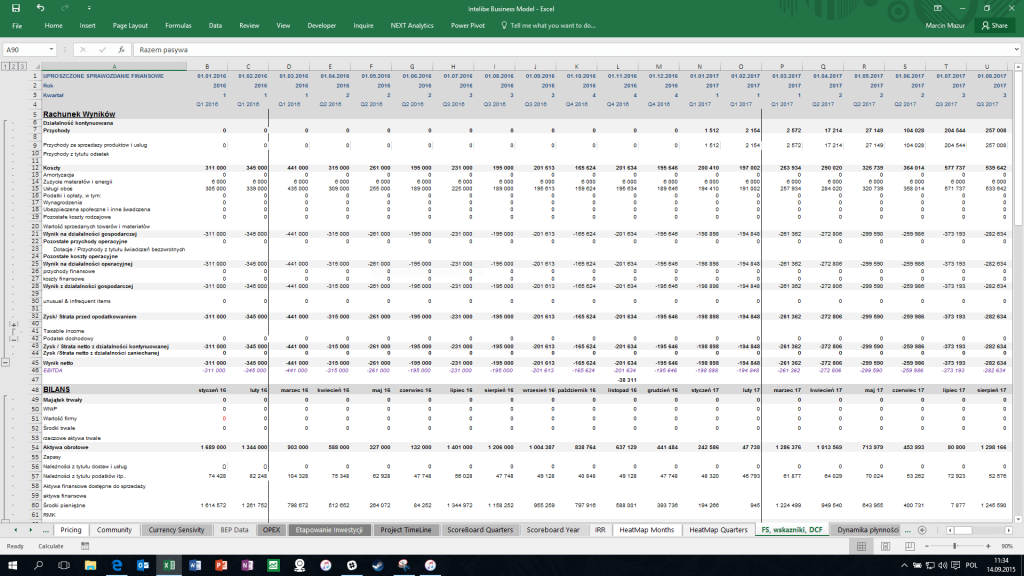
Cash flow
In a new venture, it is important to monitor the cash flow.
Our excel takes into account the planned cash inflows and outflows.
It shows where what amount should be taken into account over the next 5 years.
This gives you the ability to control your financial flows and give you an overall picture of your financial condition.

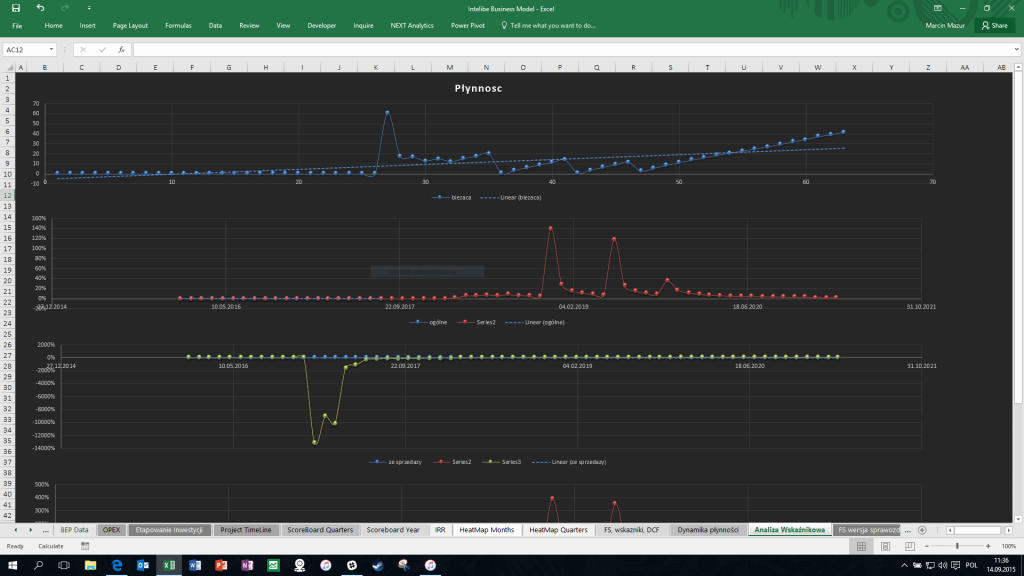
Ratio analysis
All changes in the model are reflected in the forecast ratio analysis.
The charts are linked directly to the data from the financial statements.
It enables easy index analysis thanks to accessible graphics.