
 Polski
Financial model of a farm producing cereals, fodder and milk
Farms are an industry that requires careful planning and management of data, costs and resources to succeed. Unlike other industries, processes in agriculture are closely related to nature and require close monitoring. Data management plays a key role in this process as farms need to monitor and analyze all kinds of information such as: weather conditions, soil quality, crops, animal husbandry, sales results as well as financial results.
Planning gives farm owners better control over costs, which is critical to avoid overspending and improve profitability.
Implementation prepared for an agricultural enterprise:
- cattle breeding for milk production – a herd of about 800 animals
- the cultivation of cereals for the production of fodder and the sale of cereals
- the use of 42 plots with an area of more than 1,000 hectares
- employing an average of 30 people
- annual revenue – PLN 8,000,000 on average
The primary goals for the application are:
- company liquidity management
- a dynamic company budget and a source of information for developing a financial strategy
- assessment of the entire potential of the business along with the measurement of its use and identification of the main risk factors
- full financial modelingall business areas
- enterprise valuation
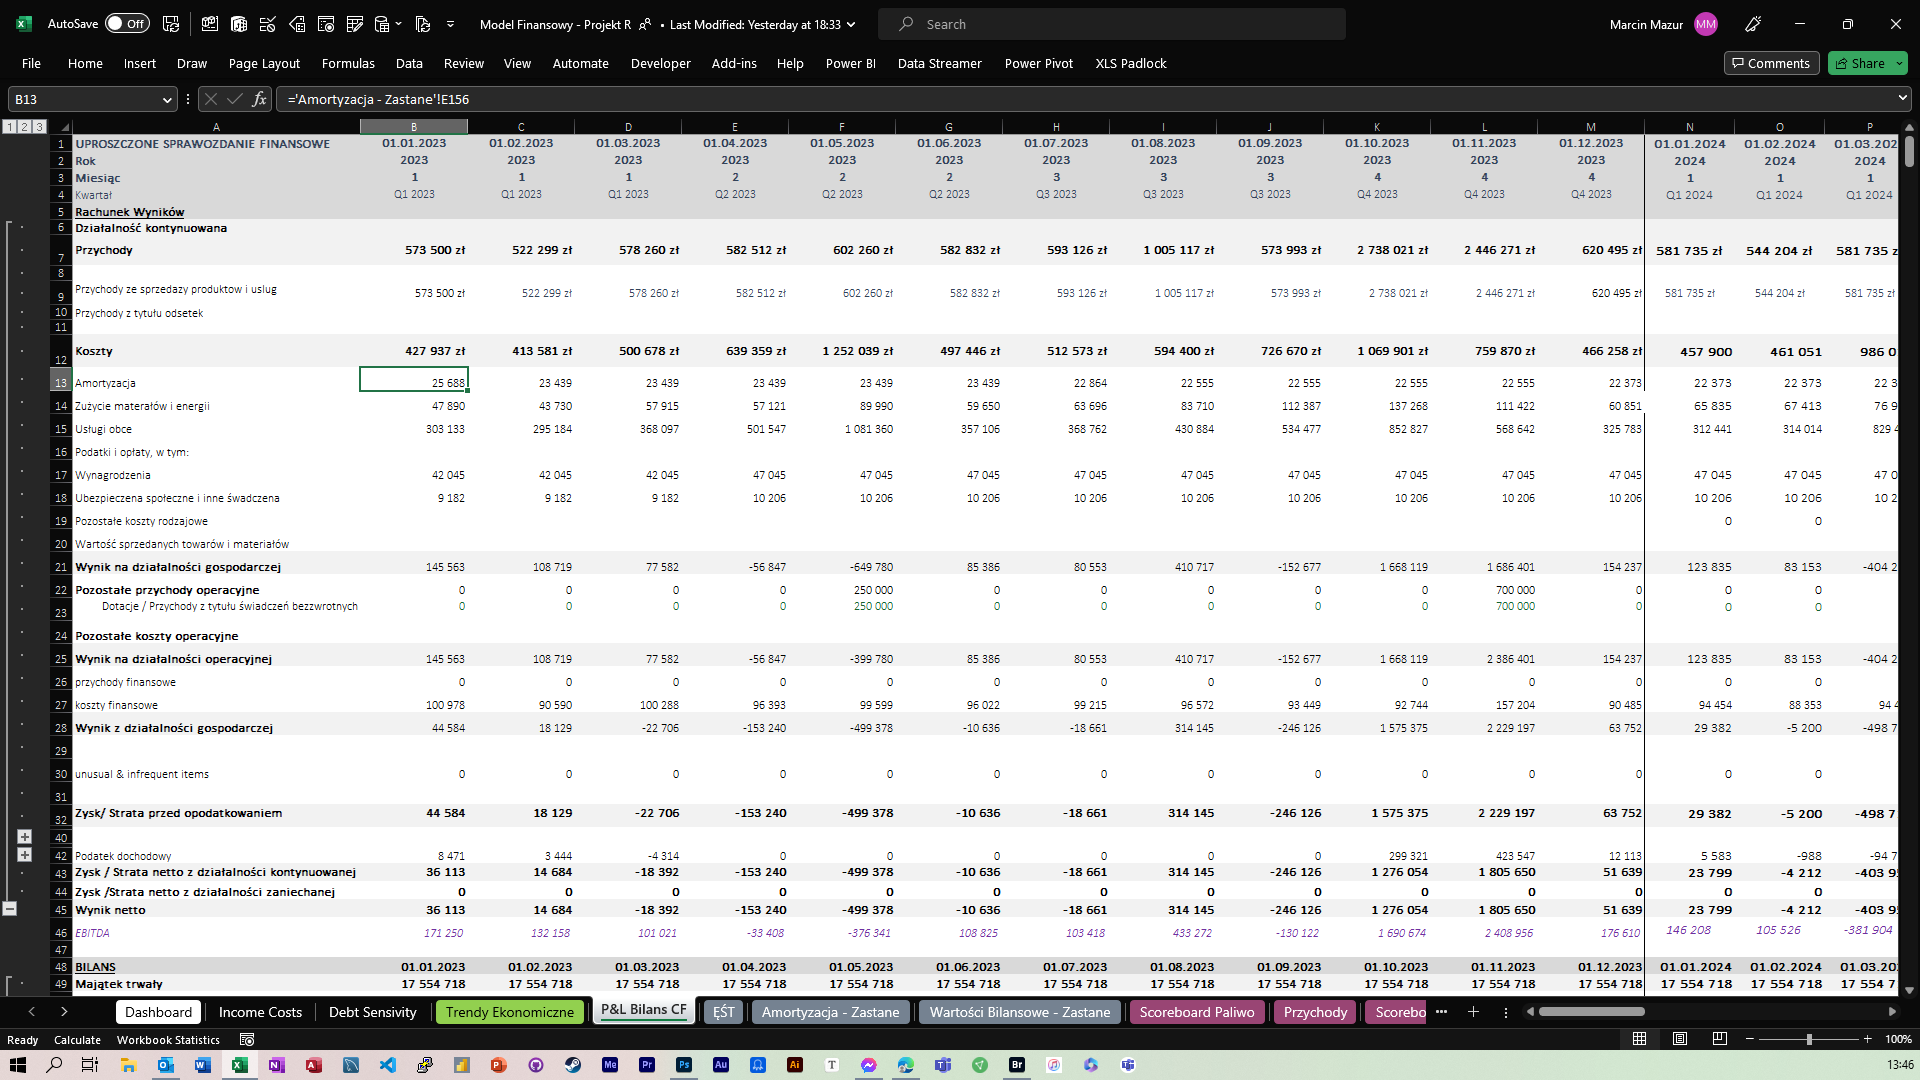
Standard Financial Projections
The Income Statement is a financial report that enables businesses to monitor their financial performance over a specified period of time. Thanks to this report, entrepreneurs have better control over their costs and income, which allows them to make better business decisions. In addition, the profit and loss account also allows you to easily compare financial results with previous periods, which allows you to assess the changes made and take more accurate actions in the future.
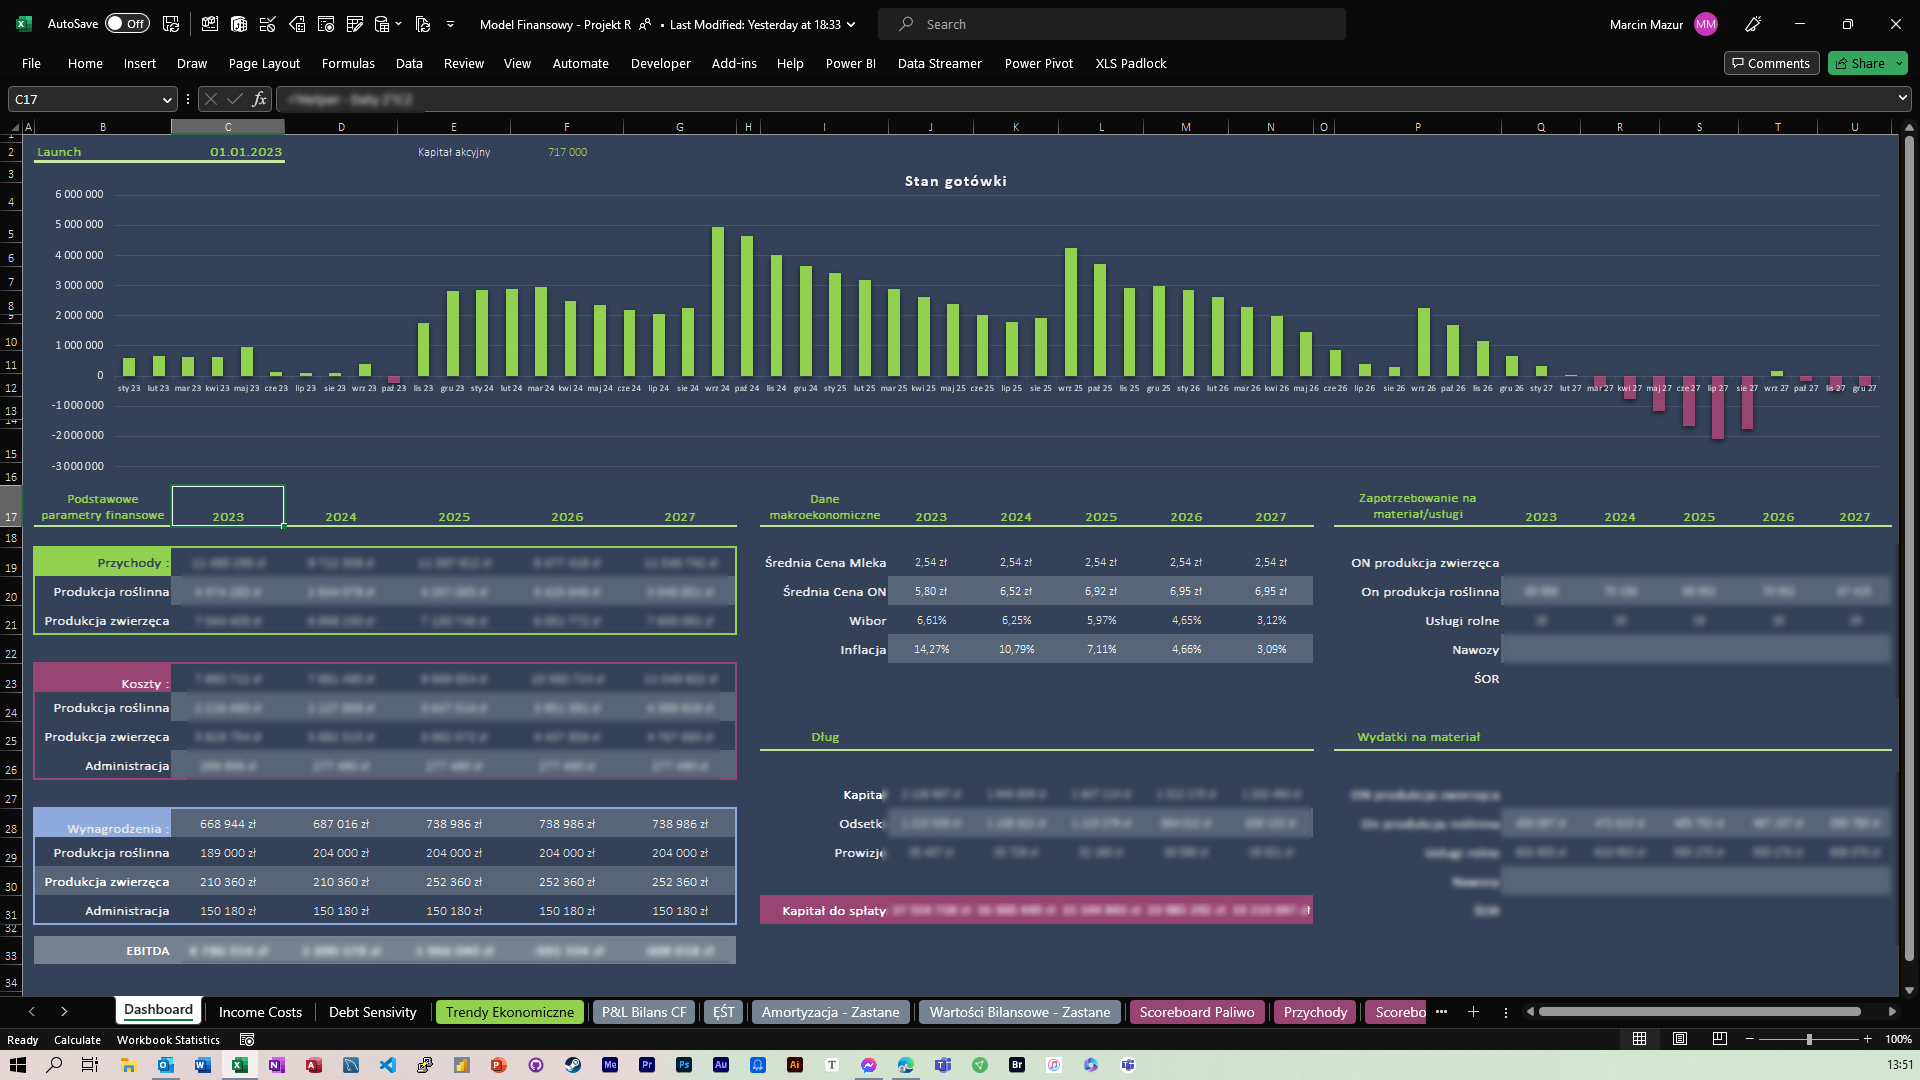
Main dashboard
The financial dashboard allows for quick and easy monitoring of key financial ratios for various business lines in the company. Thanks to this, the external CFO has insight into the current and future financial situation of the company, can quickly react to any problems and make decisions aimed at increasing profits. In addition, the data presented on the dashboard can help identify areas for improvement and develop further business strategies.
Financial model data sources
All areas of the enterprise have been parameterized, taking into account, among others, the following sets of information:
- Salaries – including the type of contract, period of employment, salary amount, business line
- Financial Liabilities
- Invoices – all costs collected and analyzed by the application to invoice accounting OMS
- Financial data collected in the application for planning and controlling agricultural crops for over 150 agricultural activities for 10 crops.
- Two formulas of feeds taking into account the eight basic nutritional groups for cows
- Data of vehicles in terms of their daily working time and diesel fuel consumption using data from a dedicated “Machine Park” application that supports fuel settlements by comparing data with the assumed consumption and the actual amount of refueling each vehicle
- Fixed Assets Register
<
Modules available in the financial model
Financial model for a farm consists of over 20 separate modules that are integrated with each other. Thanks to this model, any business analysis related to agricultural production can be carried out in a simple and quick way. With this system, it is possible to precisely plan plant and animal production, taking into account many factors, such as livestock prices, feed costs, salaries, financial costs, market trends, fertilizer prices and many others.
Each of the modules has been designed in such a way that it is very easy to use, and at the same time allows for advanced financial analysis.
All modules have been created in such a way that they are integrated with each other and allow easy data processing. Thanks to this, it is possible to conduct financial analyzes at various levels, taking into account many factors at the same time.
For example, if we increase the number of milking cows in a specific month, the financial model will automatically calculate:
- the cost of this investment,
- will correct milk production,
- calculate the value of milk sales
- verifies whether the state of own feed is sufficient – if not, it will automatically enter the cost of purchasing the missing feed
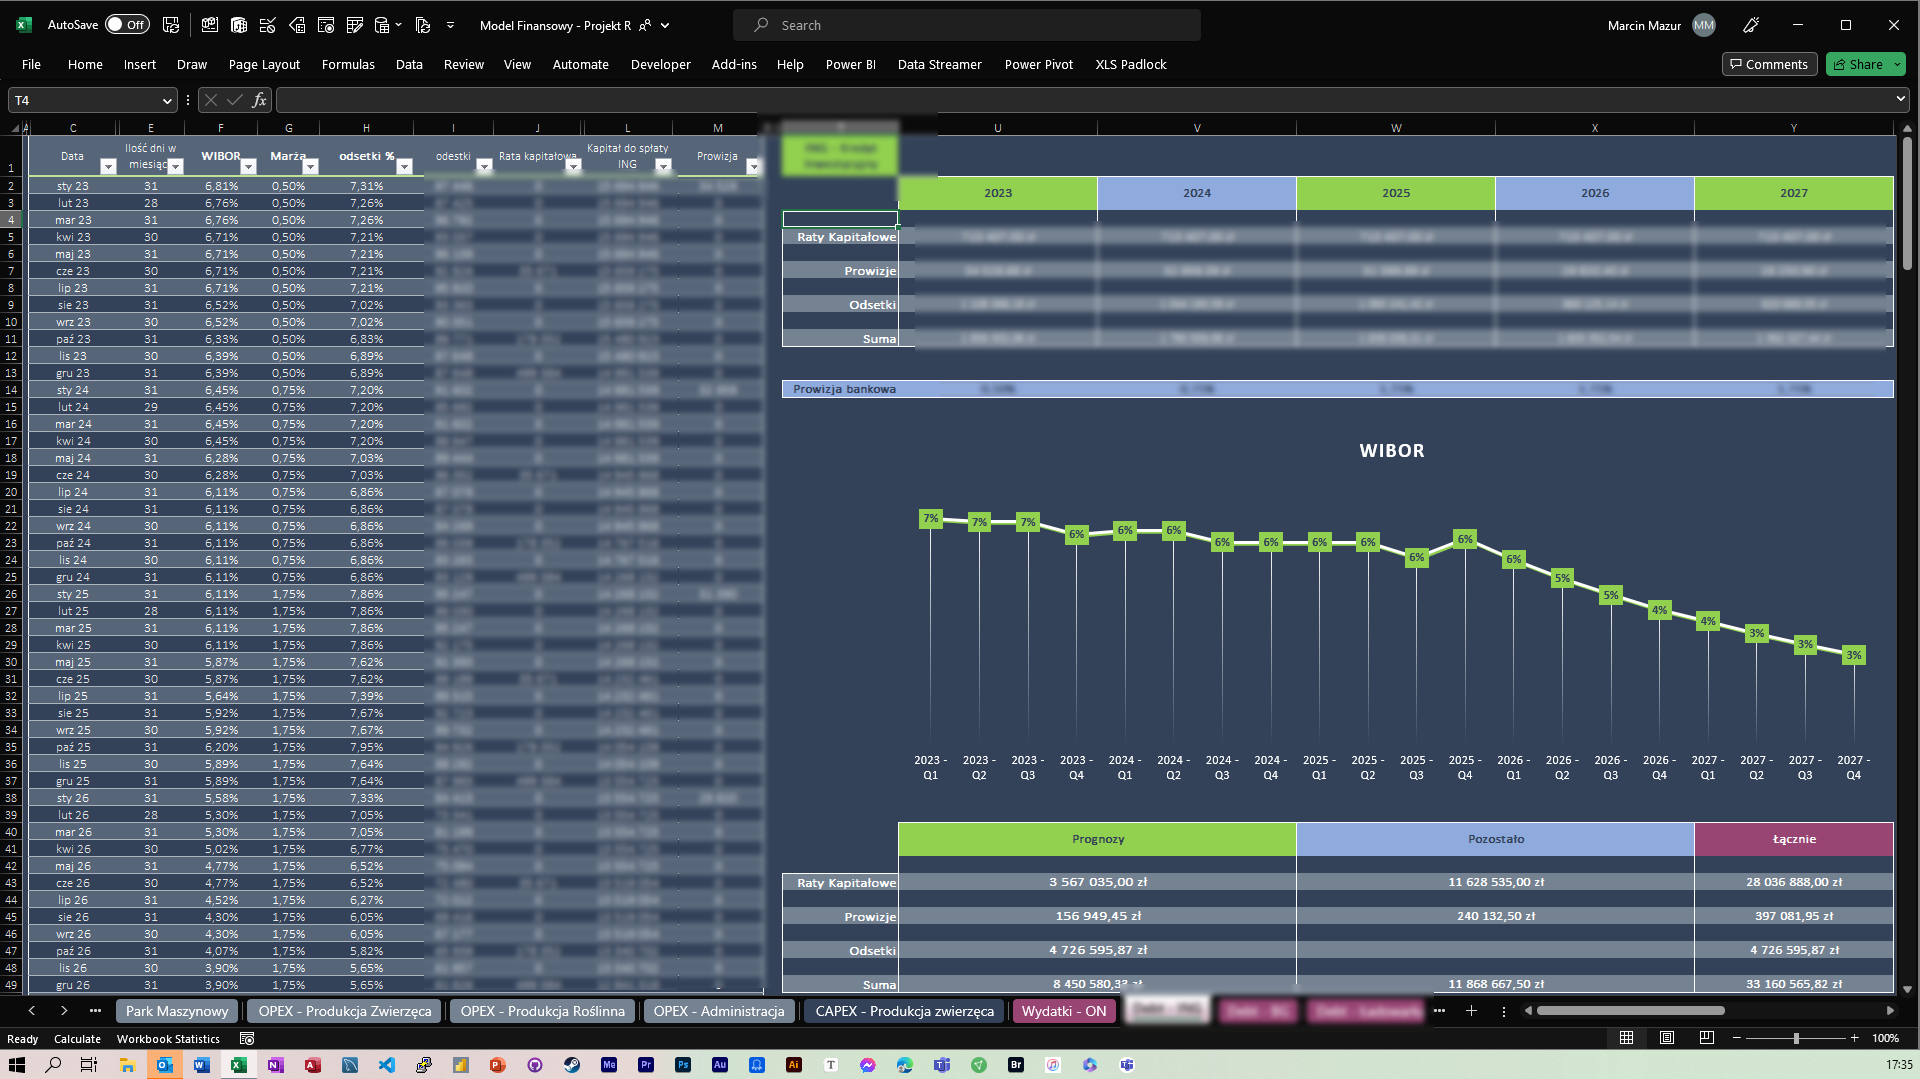
Market Trends Module
allows you to assess the company’s sensitivity to changes in individual parameters, such as raw material prices, interest rates or inflation. Thanks to this, the Management Board and the external CFO are able to analyze which factors have the greatest impact on financial results and can react appropriately to changing market conditions.


The “Market Trends” module allows you to simulate changes in the WIBOR interest rate and their impact on the company’s financial costs. In the event of an increase in the WIBOR rate, interest costs related to loans and borrowings will increase, which affects the company’s financial results. As a consequence, the company may have problems with maintaining financial liquidity or will have to take additional measures to reduce costs, such as cutting operating costs or looking for alternative sources of financing.
The financial model in this case has the ability to perform sensitivity analyzes when changing these parameters through this module.
- milk prices
- diesel prices
- electricity prices
- natural gas
- WIBOR rates
- Inflation Value
See how this functionality works in this short video.
The market trends module allows you to run simulations that allow you to identify the potential consequences of a decrease in milk prices for an agricultural enterprise. This simulation includes the determination of break-even points, which means that you can determine the minimum price that must be obtained per liter of milk in order for the company to be profitable, cover production costs or incur losses.
Investment Loan Visualization
Each financial commitment has its own visualization. The financial model has a module for enterprise debt management
There are many benefits for the CFO to have such a loan visualization. First of all, it allows you to quickly understand the financial situation of the company, which is important in making business decisions. The visualization allows you to easily see what financial liabilities the company has in a given period, when they are due and what are the total costs of paying them off. Thanks to this, the financial director can make quick decisions regarding taking out new loans, resigning from some liabilities or changing the method of repaying existing debts. In addition, this visualization allows you to easily understand the risk associated with financial liabilities, which is crucial for ensuring a stable financial situation of the company.
The module for managing loans and leases in the company’s financial module brings a number of benefits, including:
- Easier management of financial liabilities – the tool allows you to monitor the repayment schedule, payment dates, interest, commissions, as well as other costs related to the loan or leasing.
- Faster decision-making – data visualization facilitates quick understanding of the financial situation related to a loan or leasing, which enables faster business decision-making.
- Increasing efficiency and control over expenses – the tool allows for better planning and management of financial liabilities, which allows for greater control over company expenses and cost savings.
- Support for negotiations with the bank or lessor – knowledge about the repayment schedule, interest rate and commission allows for better preparation for negotiations with the bank or lessor, which may result in more favorable conditions for the company.
- Increasing financial transparency – a tool for managing loans and leases enables access to reliable financial data, which increases the company’s transparency and credibility towards business partners and investors
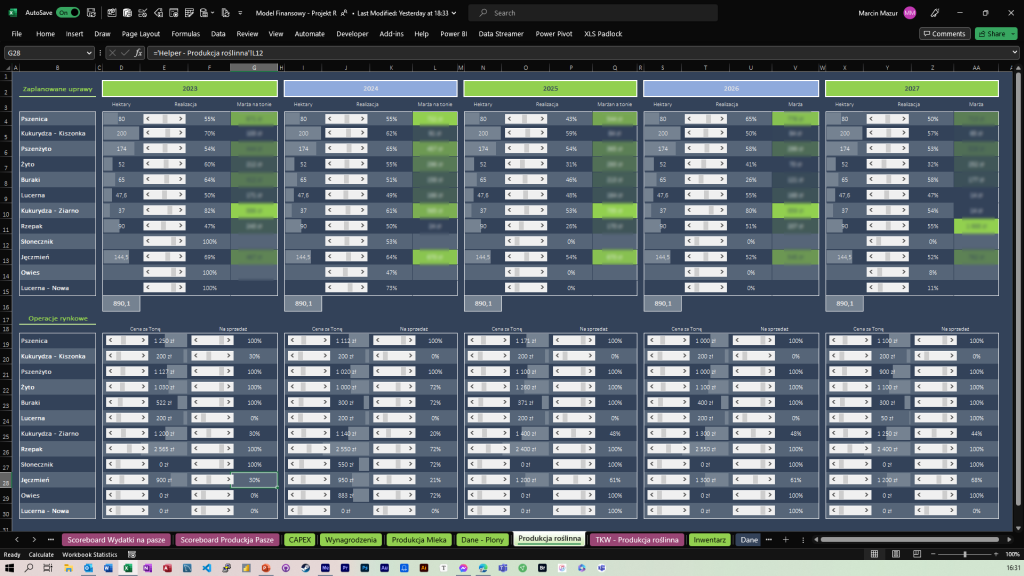
Crop production planning
To carry out the calculation, it only needs to be completed:
- the number of hectares devoted to a specific crop in a given season
- grain price forecast
- yield estimation
- Indication of the percentage that will be allocated to feed
Calculates the margin per ton, indicates the break-even point, taking into account the data contained in the financial model
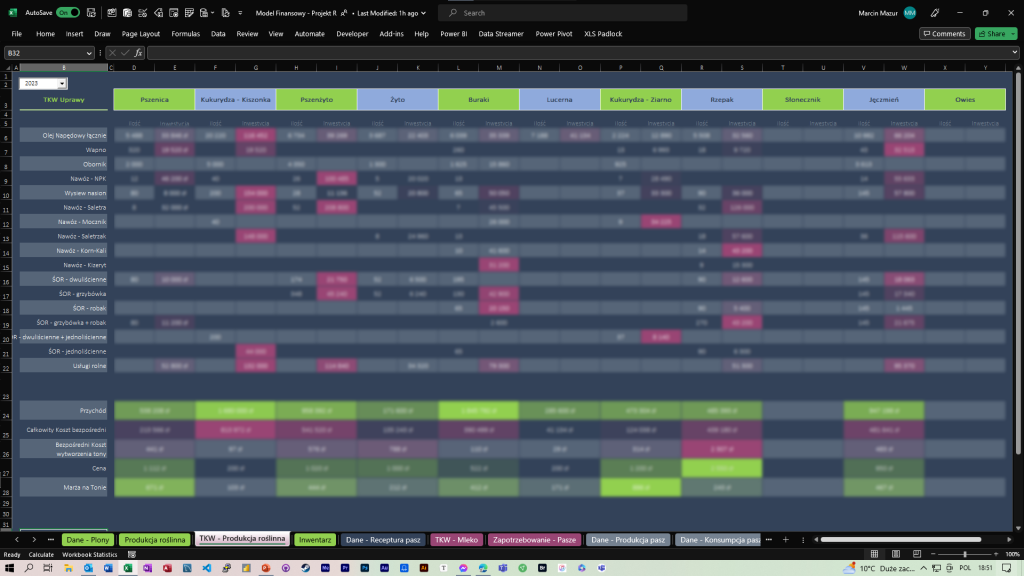
Projected technical costs of cereals and fodder production
Dashboard showing the technical costs of grain production simplifies the analysis of costs and profitability of agricultural crops,
Thanks to information on the prices of fertilizers and CPPs, it is possible to adjust the amount and type of fertilizers and plant protection products used to the prevailing situation, which allows you to reduce production costs while maintaining the quality and quantity of crops.
Demand for feed
Dashboard provides insight into the current and future demand for feed for your herd on a quarterly basis. By using data from “herd inventory”, “feed recipes” and crop production planning, the model performs all calculations.
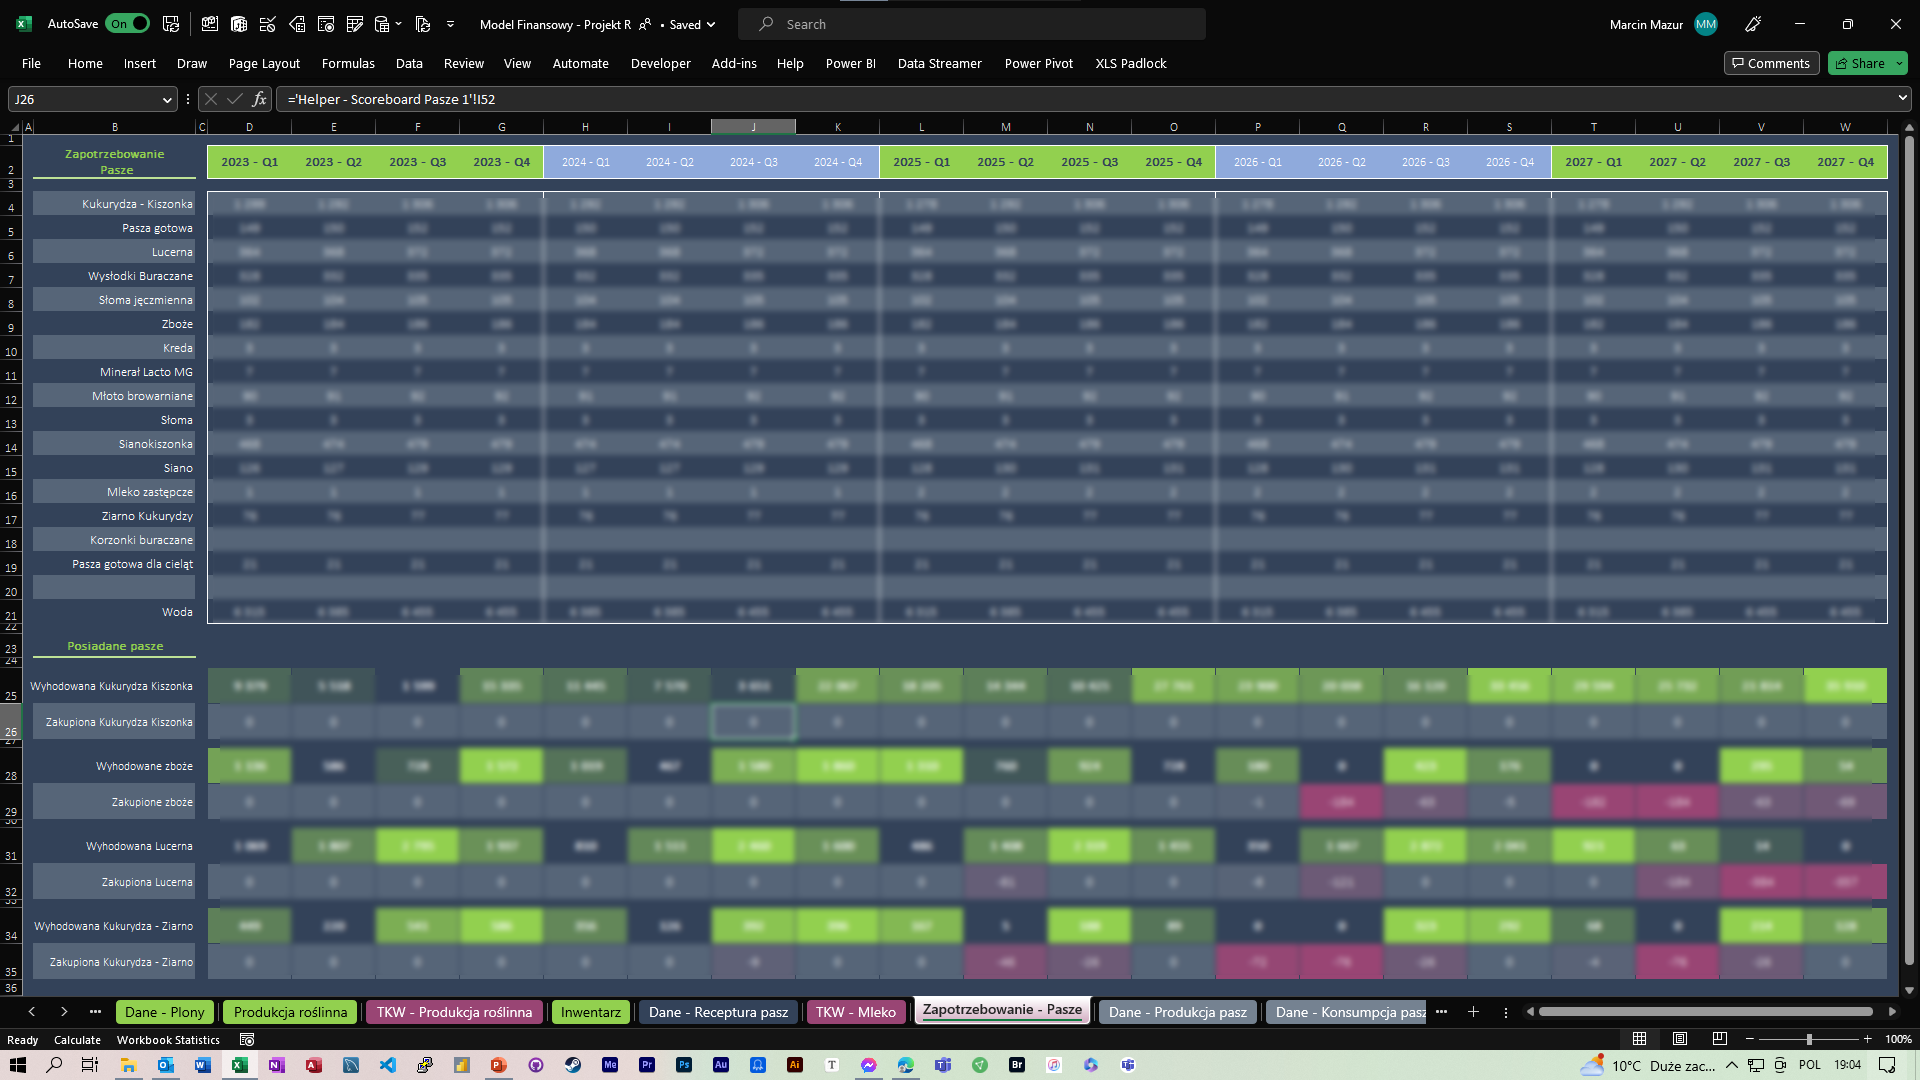
Example of use
An example of the simulation process of the impact of changes in crop production on the demand for animal feed. The financial model uses data from the herd inventory, feed recipes and crop production planning to estimate the amount of feed needed for the following quarters.
Then, by changing the parameters of crop production, such as yield, and changing the parameter of transferring crops to feed, the financial model automatically calculates and calculates whether the amount of feed produced will be enough to feed the animals in the following quarters.
In this way, the farmer can analyze and, if necessary, adjust crop production plans to ensure sufficient feed for his livestock.
Zobacz jak działa ta funkcjonalność na krótkim materiale video
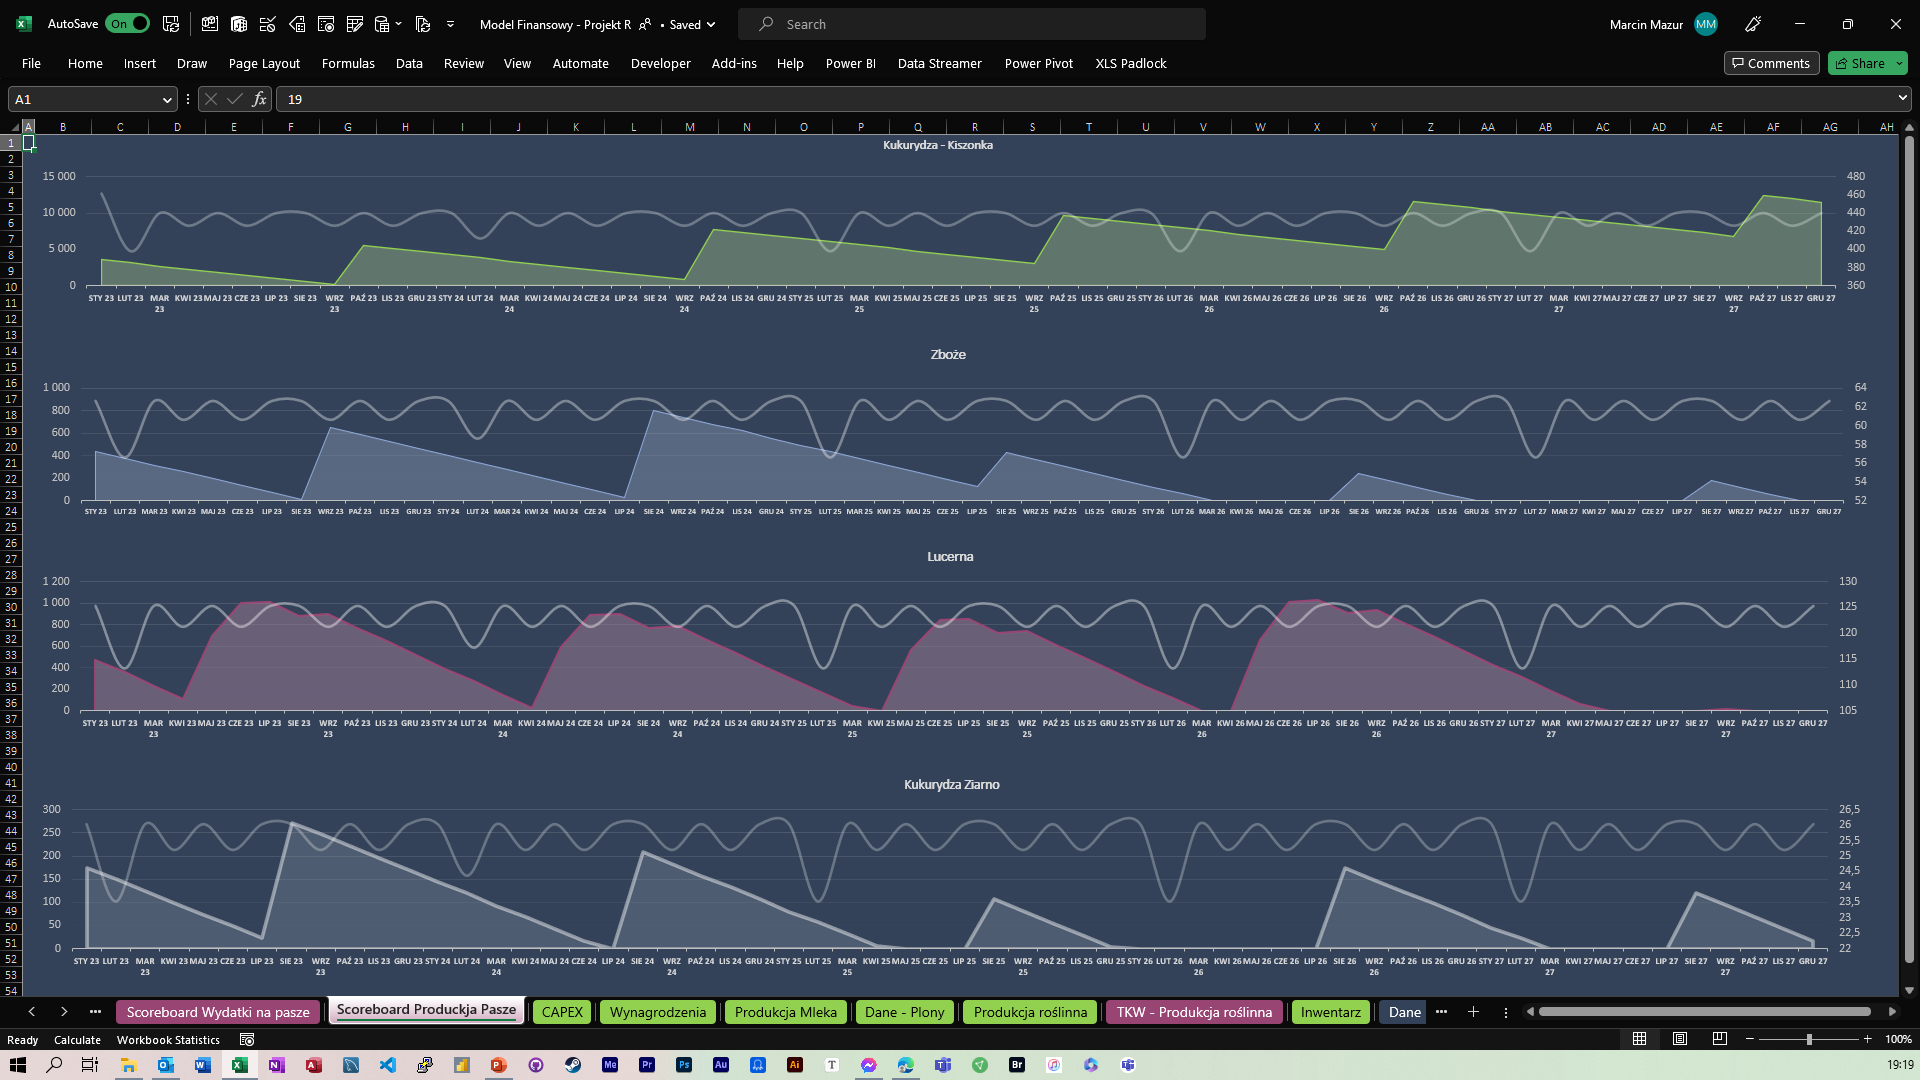
Dashboard – Feed production and consumption
allows you to visualize feed consumption and feed production over a specified period. Thanks to this, you can easily compare the demand for feed with their production and plan appropriate actions.
One of the advantages of this dashboard is the ability to quickly identify differences between feed demand and feed production. In this way, you can react in time to possible shortages or surpluses of feed and adapt production to the needs of the herd. In addition, the visualization of this data allows you to quickly understand the situation and make decisions easier. This is especially important in the agricultural industry, where optimal use of resources is crucial to success.
Visualization of feed costs
This dashboard shows a graph of feed costs on a monthly basis. Allows you to easily monitor and control your feed costs. In the event that the feed runs out on the farm, the financial model automatically creates a cost item, which allows you to track and control production costs on an ongoing basis and analyze the technical cost of producing a liter of milk

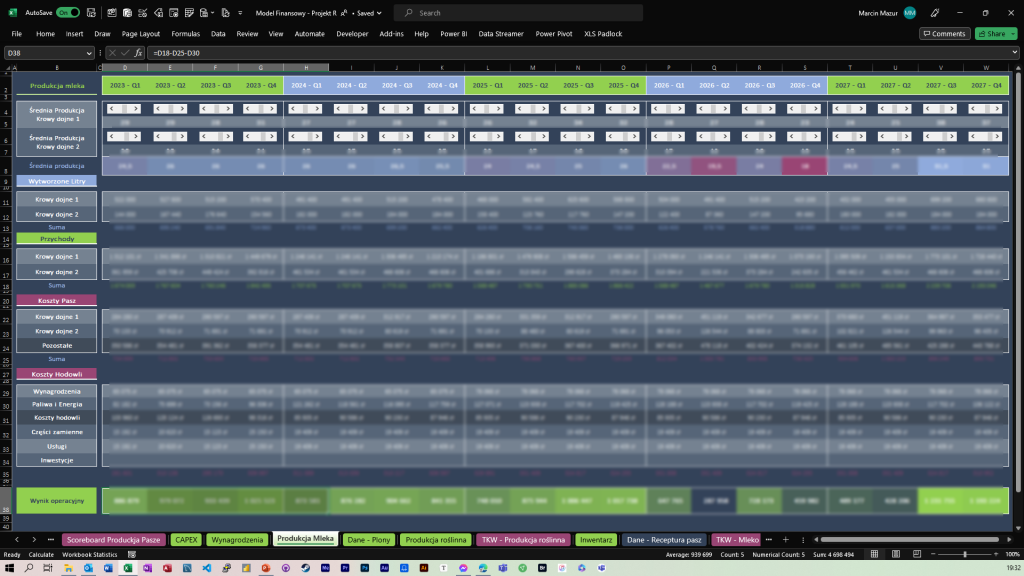
Milk production on a farm
This panel in the financial model is used to analyze milk production. You can observe how the daily average milk production changes over time and what factors may affect its changes. Possible reasons for a decrease in milk production include, for example, herd disease or unsuitable feed. Thanks to this panel, the external financial director can track the efficiency of milk production, monitor its development and make decisions based on current data.
Forecasted technical costs of producing a liter of milk
This summary shows the projected technical costs of producing a liter of milk on a farm. Thanks to such an analysis, it is possible to estimate the costs of producing one liter of milk and where savings can be found by modifying production processes or changing suppliers. The list of projected costs of producing a liter of milk in the financial model can be used to analyze the impact of various factors on production costs, for example, resignation from the production of own feed in favor of purchased from the market. Thanks to such an analysis, an agricultural enterprise can make an informed decision which actions will lead to an increase in profits and which may negatively affect the profitability of the activity.

Basic benefits of our solution
- Enables accurate tracking of costs and revenues – the financial model enables the analysis and forecasting of costs and revenues related to agricultural production. Thanks to this, the farm owner has full control over finances and can make better business decisions.
- Facilitates production planning – the financial model takes into account many factors affecting agricultural production, such as weather, fertilizer and feed prices, credit rates, etc. Thanks to this, it allows for better planning of production and increasing its efficiency.
- Enables comparison of results – thanks to the financial model, you can compare financial results with previous periods or with other farms. This allows for a better understanding of the market and competition and making more profitable decisions.
- Facilitates risk management – the financial model allows for the analysis and forecasting of risks related to agricultural production, such as unfavorable weather conditions, increase in feed prices or herd diseases. Thanks to this, you can properly protect yourself against financial losses.
- Enables better use of resources – thanks to the analysis of costs and effectiveness of individual activities, the financial model allows for better use of resources, such as land, machines and human work. This leads to an increase in the profitability of agricultural production.
- Enables you to react quickly to market changes – the financial model allows you to keep track of market changes and react quickly to them. Thanks to this, the farm owner can adapt production to changing conditions and maximize profits.


