Twoje dane
nasza analiza
Twoja przewaga
ZAOSZCZĘDŹ CZAS I PODNIEŚ z NAMI EFEKTYWNOŚĆ FIRMY
Analiza finansowa na najwyższym poziomie
Zamieniamy zbiory danych w kompleksowe raporty
Przeanalizujemy wszystkie obszary firmy i dostarczymy rekomendacje oraz narzędzia Business Intellige usprawniające procesy.
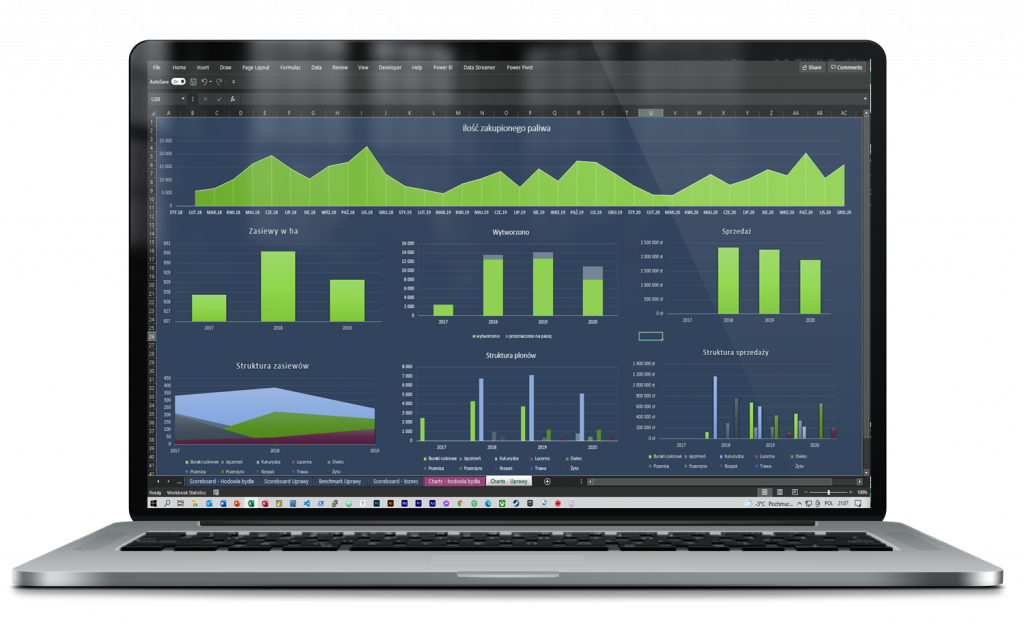
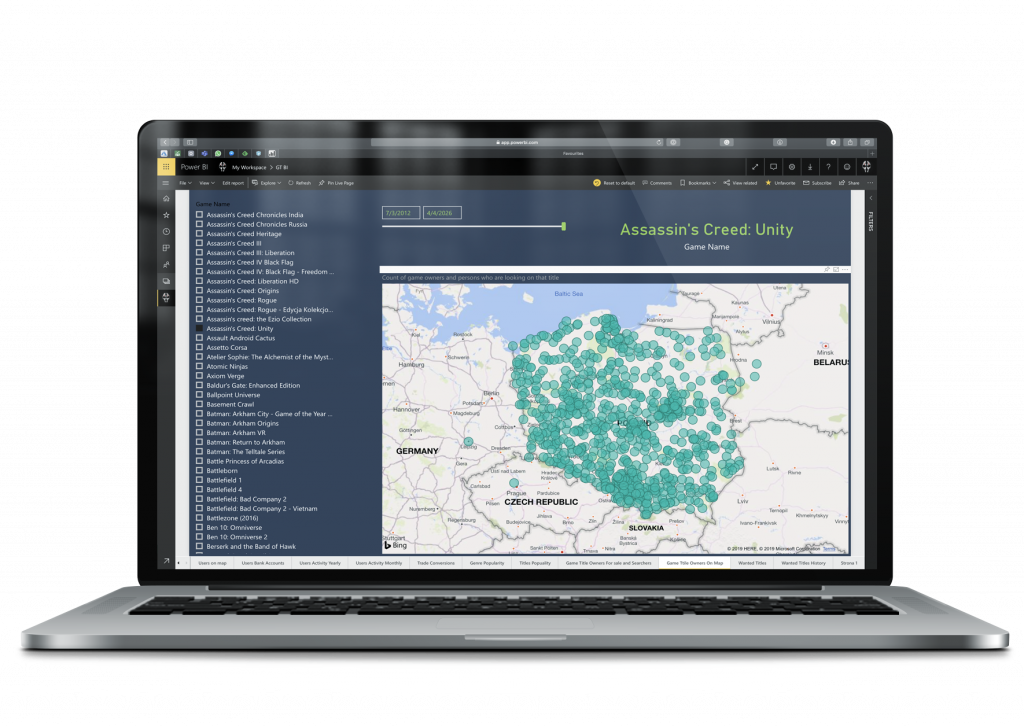
Przygotujemy dashboard’y pod zbiory danych z wielu źródeł który umożliwiają szybsze podejmowanie decyzji oraz analizę procesów.
Zapewnimy opracowanie strategii rozwoju oraz inwestycji. Wskażemy sposoby skalowania biznesu obejmujące M&A oraz dotacje.
Znajdziemy niewykorzystywane zasoby firmy i wskażemy jak można je użyć celem zwiększenia wyników firmy i jakości pracy.

Ukazanie rzeczywistej kondycji przedsiębiorstwa
Maksymalizacji wyników.
Usprawnienia kontroli nad procesami zachodzącymi w firmie.
Wprowadzenia cyfrowej transformacji w zakresie controllingu oraz współpracy zespołów.
Klientom oferujemy usługi dyrektora finansowego na godziny:

Nasi klienci otrzymują profesjonalne zautomatyzowane narzędzia i rozwiązania wspierające w: