
CALCULATION MODULE – SAVINGS PRESENTATION AND PROJECTIONS FOR CLIENTS
Supporting the sales process by showing the client real savings — now and in the future.
The calculator application:
- compares the cost of currency exchange on the platform against the bank’s offer,
- accounts for individual transfer fees,
- simulates savings over a given period and over a longer time horizon.
As part of the currency exchange platform system, a sales module was built in the form of a calculator whose primary goal was to show clients the real savings from using the currency exchange platform.
The solution increased conversion in the sales process by showing the client not only the immediate benefit, but also the future savings potential — in a concrete, numerical way.
The tool:
- used Forex rate data,
- automatically accounted for the actual transfer fees for each bank,
- presented the client with a detailed savings analysis compared to banking solutions,
- generated projections of potential savings from continued use of the platform,
- supported advisors in the sales process with data and simulations that were clear and persuasive.
MARGIN AND SAVINGS ANALYSIS
The designed interface allowed the sales representative to:
- enter all transaction parameters (currency, time, value, bank),
- instantly obtain a cost comparison,
- show the client the margin difference — in percentages, pips and monetary values.
This made the application a tool for persuading through numbers — not through declarations.
- bank, transfer type, order method, presence of IBAN,
- current bank rates and own promotional rates,
- full cost simulation over one month and two years.
The solution allowed the client to immediately see the opportunity cost — and the potential benefit.
RATE COMPARISON – HISTORICAL AND CURRENT DATA
One of the key elements of the application was a module that enabled:
- automatic retrieval of the historical Forex rate for a given day and time,
- comparison with the bank rate and the rate offered on the platform,
- calculation of the actual cost difference for each transaction — including retroactively.
The application combined current market conditions with historical data analysis — creating a complete picture of potential savings.
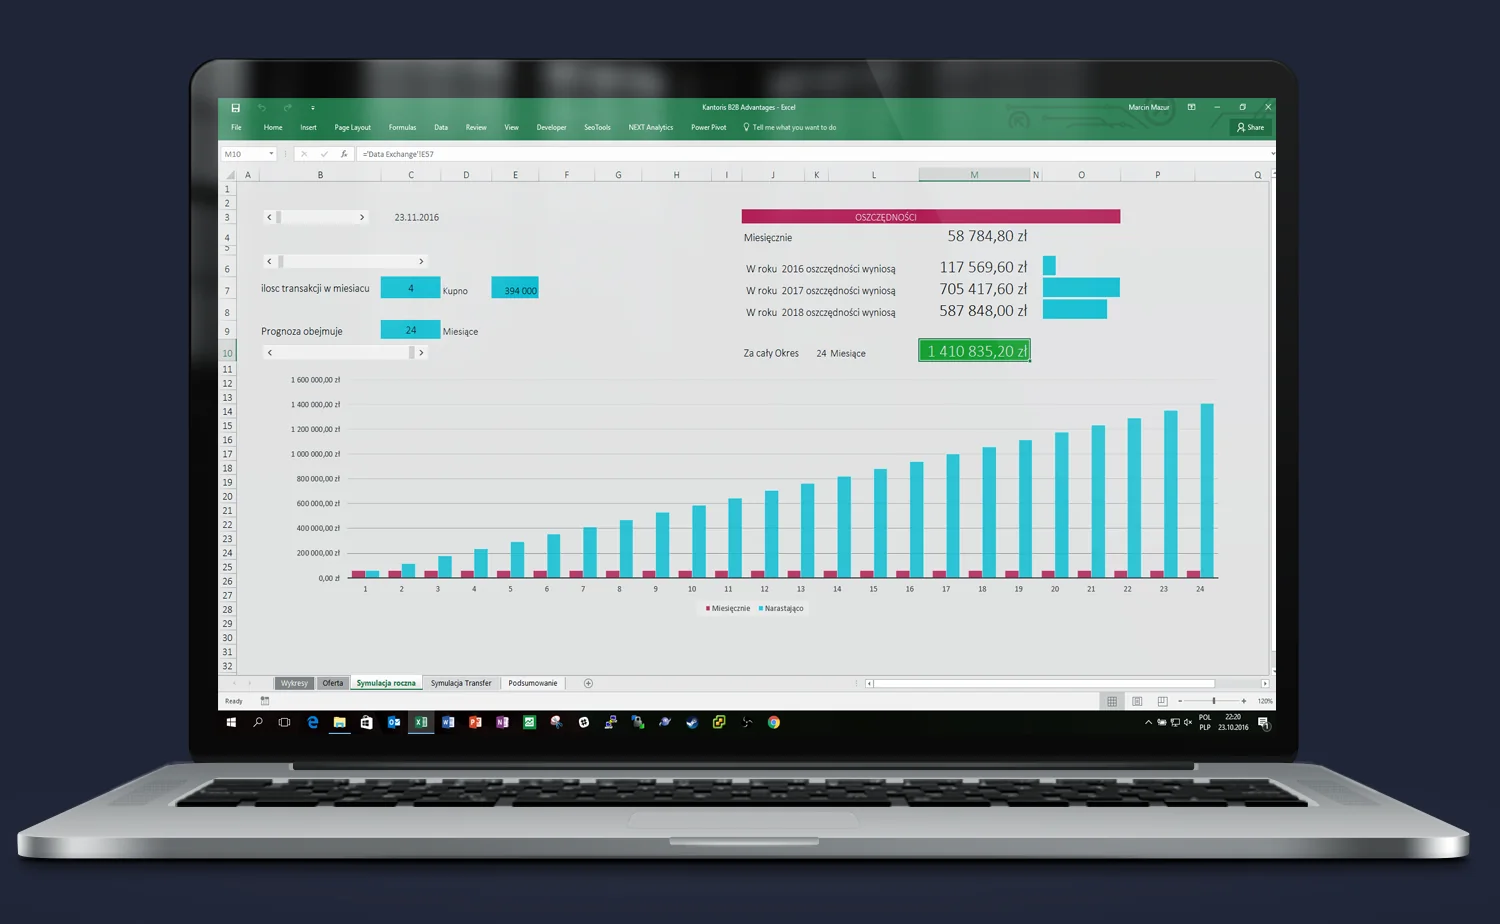
DYNAMIC SAVINGS PROJECTIONS
A compelling simulation, based on your operational data
- number of transactions per month,
- value and frequency of operations,
- cost differences between systems or financial service providers.
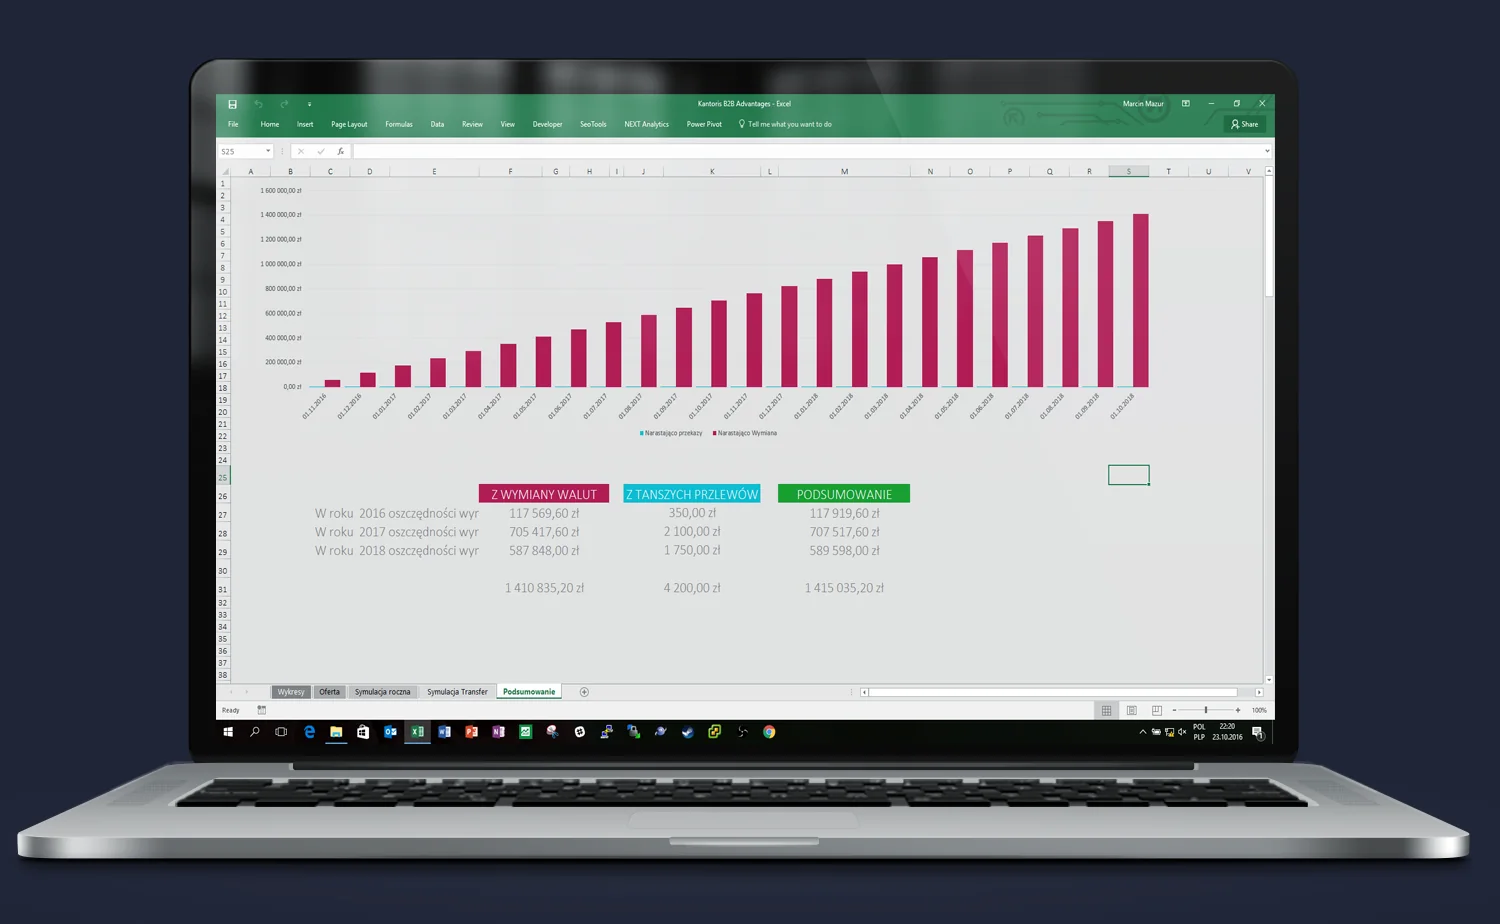
The built-in forecasting function calculates savings over months and presents them as a growing bar chart.
Displaying cumulative data over time creates an immediate “wow” effect — ideal for board meetings, conversations with a business partner or as part of a professional proposal.
Everything in a single file, with no need to launch additional systems — Excel is all it takes.
Need someone who understands the problem instantly — and knows what to do about it?
Most companies have data. What they lack is an idea of what to do with it — and someone who will actually execute it. Origami Effect delivers both.