
Artemis · Echo — Decision Layer for Investment Projects
Complex development projects and commercial real estate projects suffer from the same issue as market analysis. Decisions involving budgets worth millions of zlotys are made based on gigantic, multi-spreadsheet financial models in Excel that only their author fully understands. Every attempt to change a scenario requires hours of recalculation, and the investment committee receives a static report with only one version of the truth.
Artemis and Echo change these proportions. They take advanced financial-operational data from models calculated in Excel and, using Clio, load them into the database in various business variants. Iris turns these raw structures into an interactive, clean picture to which the investor has instant access in the browser.
One screen. Full structure of the three financial statements. Data drilling from macro level to individual budget items. No searching for formulas.
The problem solved by Artemis · Echo
A real estate financial model is a living organism. Investment expenditure schedules, rental rates, commercialization levels, operating costs, or seasonality parameters for hotels and short-term rentals (STR) all change.
The problem is that traditional BI systems are too rigid to reflect the multi-variant nature of DCF models, while traditional Excel is illegible during management meetings. The investor is left with a file in which changing one parameter requires clicking through ten tabs, and the risk of a formula error paralyzes the decision-making process.
What reality looks like without Artemis · Echo
Comparing an optimistic scenario with a pessimistic one requires opening separate files or manually copying tables into PowerPoint.
Analysis of CapEx structure ends at general categories — reaching information on exactly how much window joinery or the BMS system costs requires searching through executive cost estimates.
The impact of seasonality on liquidity (Cash Flow) is estimated “by eye” based on annual averages, instead of a precise day-by-day view across the entire year.
Management and the fund operate on reports dated a week ago. There is no quick export of clean data with context for external systems or AI models.

What Artemis · Echo changes
Artemis visualizes the complete business logic of the project. The investor receives an interface where one click switches the entire set of financial statements between scenarios A, B, C, and Baseline. All charts, tables, and cost structures rebuild instantly.
The system not only shows dry results but also allows immediate drill-down. You see a revenue deviation? You click and go down to the level of a specific commercial space (Space 1, 2, 3) and its daily occupancy.
System architecture — how data from the model reaches the screen
First layer: Artemis — Advanced Excel Model + Clio
The computational core remains a powerful, precise financial model in Excel that maps the full physics of the investment. The Clio engine automatically aggregates the generated business variants, cleans the data, and loads it into a structured database, preserving model history and versions.
Second layer: Iris Financial Render (React)
Iris connects to the API and renders financial data in dedicated components. The system automatically builds the reporting structure (Three Statements) and commercialization models, ensuring mathematical consistency between macro charts and micro tables.
Third layer: Multi-Export & AI Prompt Context
All calculated data is immediately available for download in XLSX, PDF, and as a dedicated AI JSON file. The JSON format contains full structured financial context, ready to be fed into language models for automatic interpretation of results.
What Artemis · Echo calculates and Iris visualizes
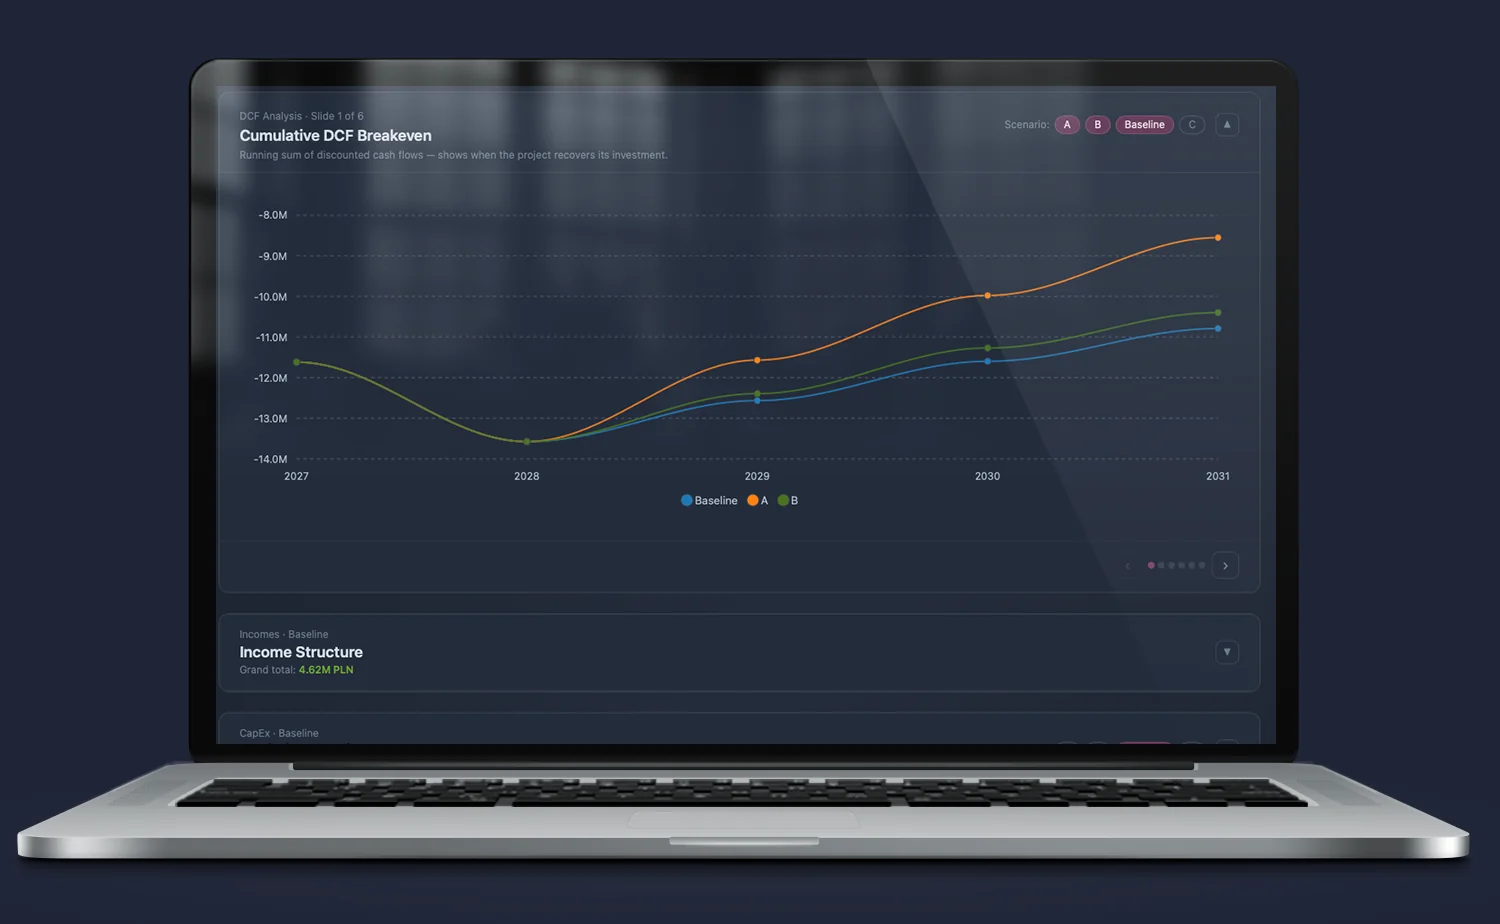
Cumulative DCF Breakeven — multi-scenario profitability threshold
Traditional charts show one return line. Iris overlays cumulative discounted cash flows for all scenarios on a single timeline. The cursor precisely indicates the moment the line crosses zero (breakeven) and the level of maximum capital commitment, revealing the investment’s safety margin in a fraction of a second.
Financial Statements Model — integrated three statements
Visualization of the Profit & Loss (P&L), Balance Sheet, and Cash Flow on dynamic annual trend charts. The investor sees relationships such as Incomes vs. Costs, EBITDA vs. Cumulative EBITDA, and dynamic correlations between capital structure and cash equivalents at year-end.
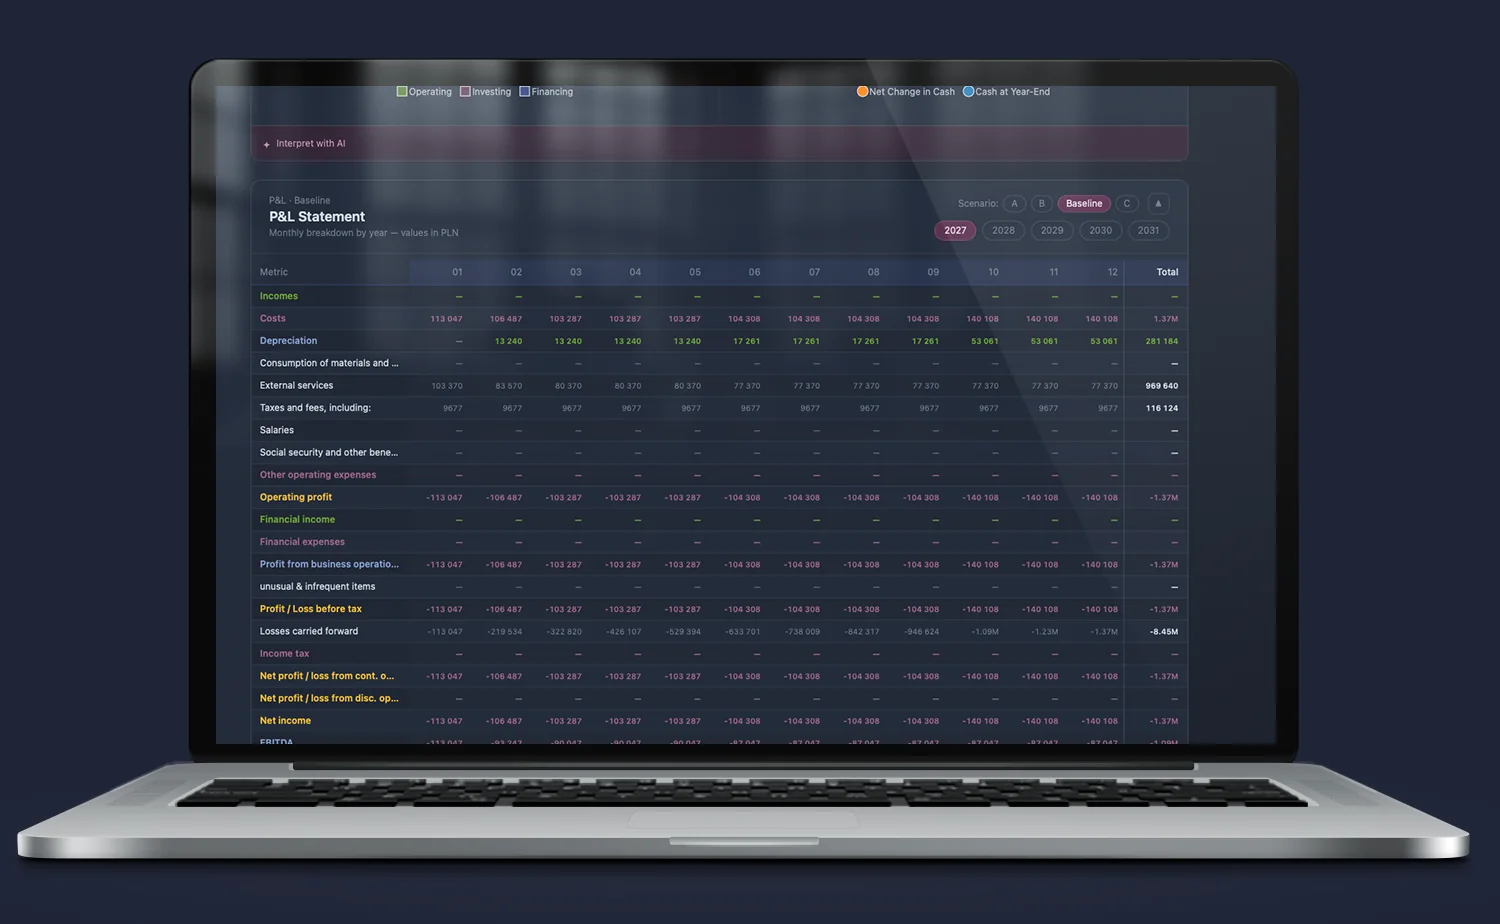
Monthly Drill-down — micro accounting structure in a table
No more blind trust in annual aggregates. Clicking any year on the chart expands a precise monthly structure (M01 to M12) below. The system shows exact cost lines (depreciation, external services, taxes, fees) and calculates monthly Cumulative EBITDA for the selected period.
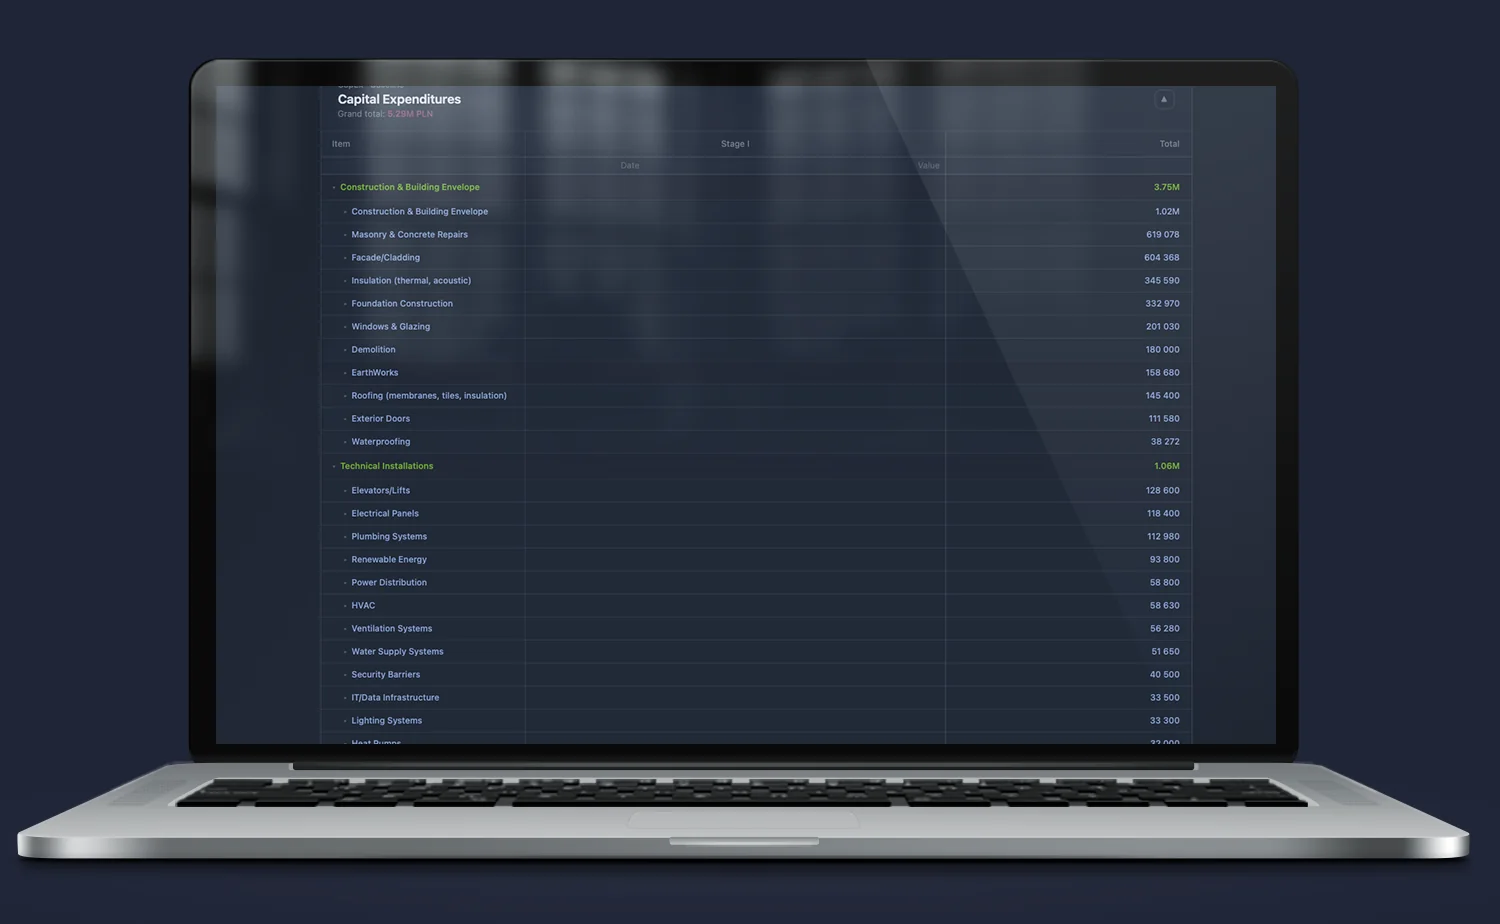
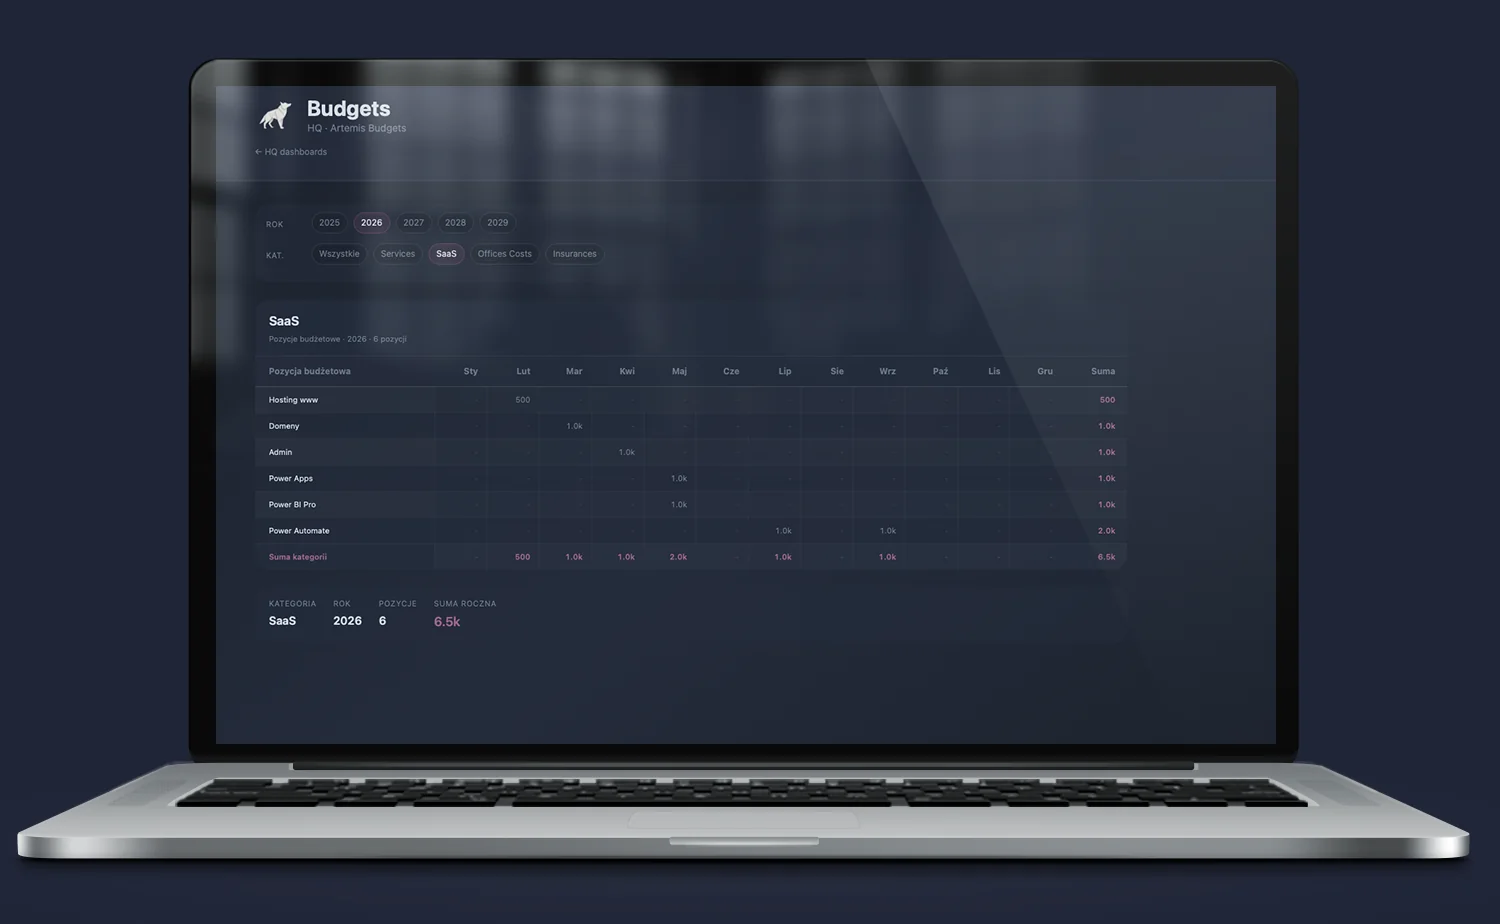
CapEx & Budgets Drill-down — from category to single license
Full breakdown of investment expenditures (CapEx) and fixed costs according to budget hierarchy. You can analyze building construction costs step by step or dive into operational budget details (e.g. SaaS category), checking monthly costs for hosting, domains, or licenses such as Microsoft Power Automate and Power BI.
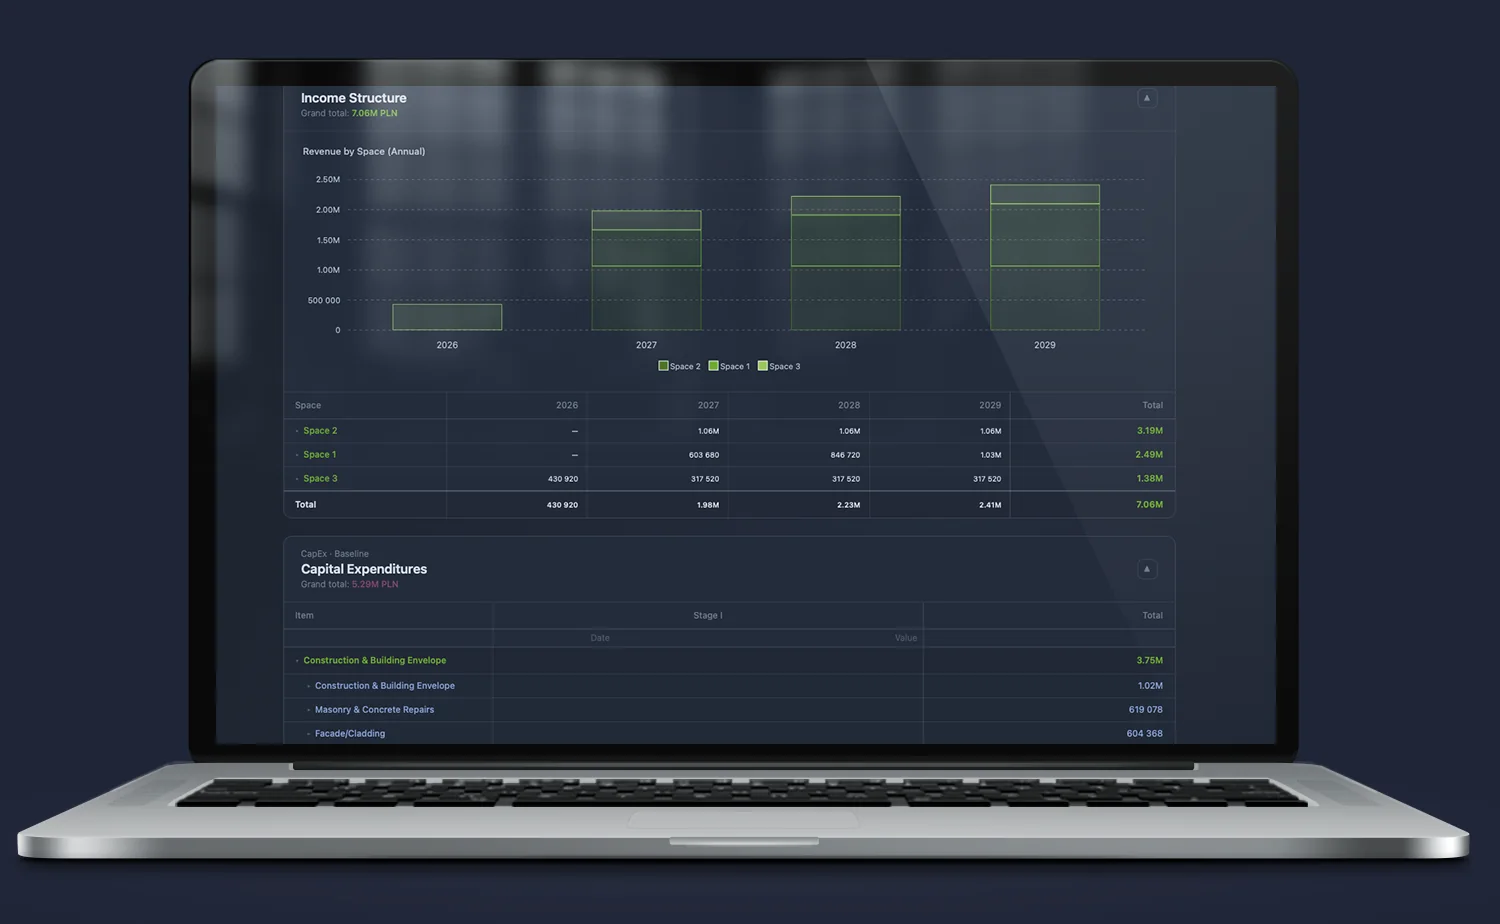
Income Structure — revenue diversification by space
Histogram and linked table showing revenue structure (Incomes) over time, broken down by individual commercial units (e.g. Space 1, Space 2, Space 3). You can immediately see which segment is responsible for the lion’s share of the financial result and which is not meeting model assumptions.
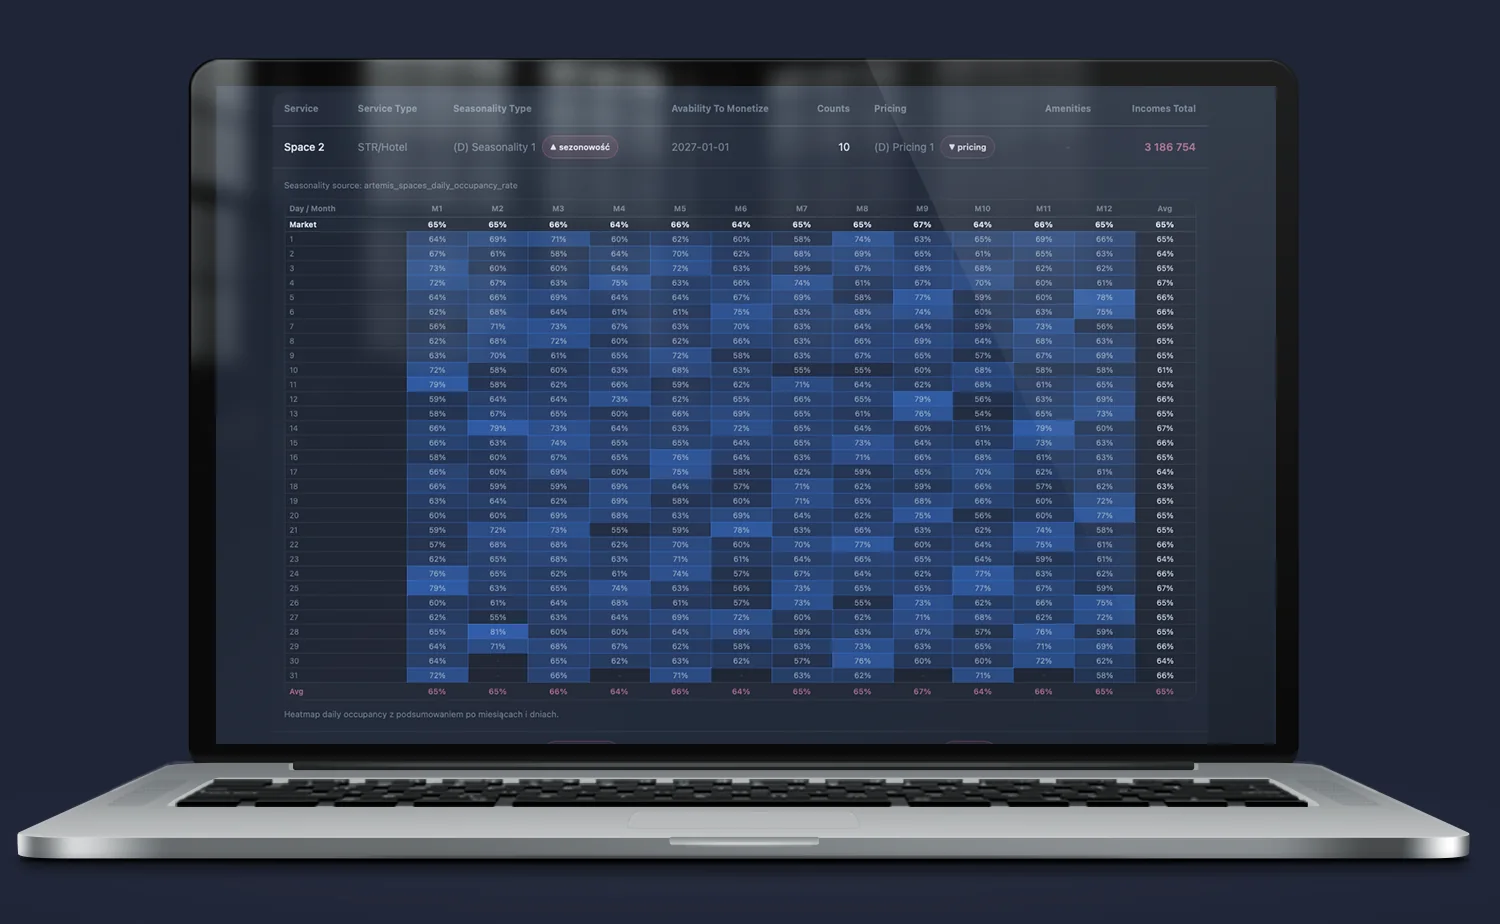
Daily Occupancy Heatmap — physics of seasonality and occupancy
The deepest operational layer of the commercialization model (e.g. for hotels/STR). An interactive heatmap shows occupancy percentage (%) for every single day of the year (1 to 31, across 12 months), taking into account fixed seasonality parameters and market price lists. You see the real operational performance of the space day by day.
Budgets & OpEx — Granular control of operating costs
The system eliminates general, “flat” cost categories, replacing them with a full operational hierarchy. The panel allows precise filtering of fixed and variable costs by year and specific category (e.g. Services, SaaS, Office Costs, Insurance).
In the detailed view, every budget item (e.g. hosting, domains, administration, or specific licenses such as Power Apps, Power BI Pro, and Power Automate) is broken down by month (Jan–Dec) with automatic calculation of the annual total for the subcategory. This provides full insight into operating expenses and immediately highlights moments when the budget is being exceeded.
AI Layer — Interpretation of precisely calculated data
The built-in AI module does not guess or generate general market advice.
Thanks to the “Interpret with AI” function, the system takes a generated JSON file containing complete, hard computational context directly from Excel. The algorithm analyzes the loaded statement variants and helps interpret them in natural language, and can give them a narrative form.
Implementation effects — what changes in practice
- Instant stress-testing of the project. Instead of tedious parameter changes in spreadsheets, the investment committee tests the model’s resilience to construction cost increases or occupancy drops using simple scenario selectors.
- Budget transparency for partners and LPs. Passive investors and funds receive a clean, professional dashboard that builds trust — they see the full structure of the three statements without digging through a jungle of formulas.
- Cost drilling down to a single invoice level. The system allows instant transition from an overall CapEx amount to detailed cost estimate items, providing full control over budget reserve overruns.
- Mathematically captured seasonality, not intuitive. Thanks to the day-by-day occupancy heatmap, cash flows (Cash Flow) reflect the real physics of the business, not smoothed averages from a spreadsheet.
- Data ready for further work. One click allows downloading a PDF report for a meeting, a clean XLSX file for the analyst’s own work, or a JSON file prepared for external reporting systems.
FAQ
How does data from the spreadsheet get into the system?
Everything happens automatically via the Clio module. The financial model file in the appropriate structure is mapped and sent to the system. Every business variant calculated in Excel becomes a separate, independent scenario (A, B, C, Baseline) available in the Iris panel.
Can I control permissions and access to budget data?
Yes. The Iris visual layer allows full role management. You can decide whether a given partner, investor, or project manager sees the full structure of the three statements or only selected operational budgets (e.g. CapEx for a specific project phase).
What is the AI JSON button for?
The button allows exporting the complete set of calculated indicators and financial structures along with a special contextual prompt. Such a file is perfectly formatted for advanced LLM models, enabling instant feeding of external AI systems to generate narrative analysis of your project.
Do you need someone who instantly understands the problem — and knows what to do with it?
Most companies have data. What’s missing is the idea of what to do with it — and someone who will actually execute it. Origami Effect provides both.