
Agricultural farms generate data that no other industry produces.
Every hectare, every cow, every combine harvester run, every ton of milk, every laboratory sample — all of this generates numbers that have a direct impact on the financial result. The problem is not that this data is missing. The problem is that it sits in separate spreadsheets, in the agronomist’s head, in the registers kept by the zootechnician, in last week’s laboratory results, and in Excel files that the owner won’t open between meetings with the bank.
Demeter, Gaia, Echo and Hebe change these proportions. Demeter is probably the most accurate financial-operational model for an agricultural farm — built in Excel, mapping the full physics of production.
Gaia records every field activity and every logistics event. Hebe is a dedicated dairy analytics system — production, quality, deliveries, feeding, costs, and herd health.
Clio aggregates data from all three layers and loads it into a structured database. Iris turns these raw structures into interactive dashboards available in the browser — without opening a file, without asking an analyst for a summary, without waiting until the end of the month.
Five systems. One interface. The entire farm in one view.
The problem solved by Iris · Demeter · Gaia · Hebe
An agricultural farm is one of the most operationally complex businesses. Revenues depend on weather, contracts, purchase prices, and herd performance simultaneously. Variable costs — feed, fertilizers, plant protection products, fuel — change every season. CapEx is multi-year and difficult to link to current results. Milk quality measured daily translates into the purchase price — and that difference seen monthly amounts to hundreds of thousands of zlotys per year.
The problem is that traditional ERP systems for agriculture are too rigid to reflect the specifics of a particular farm, while Excel becomes illegible when the owner wants to make a decision before going to the barn at six in the morning.
What reality looks like without this system
The owner wants to know if milk production is on track and how fat and protein performed last month compared to the previous year. The answer requires opening at least three files — the Demeter model, the Hebe spreadsheet, and laboratory results — and manually combining the data.
Comparing the cost of producing a ton of wheat on plot No. 12 with plot No. 43 requires combining operational costs from Gaia, yields from harvest records, and purchase prices from contracts. Without the system, no one does this — because it takes hours.
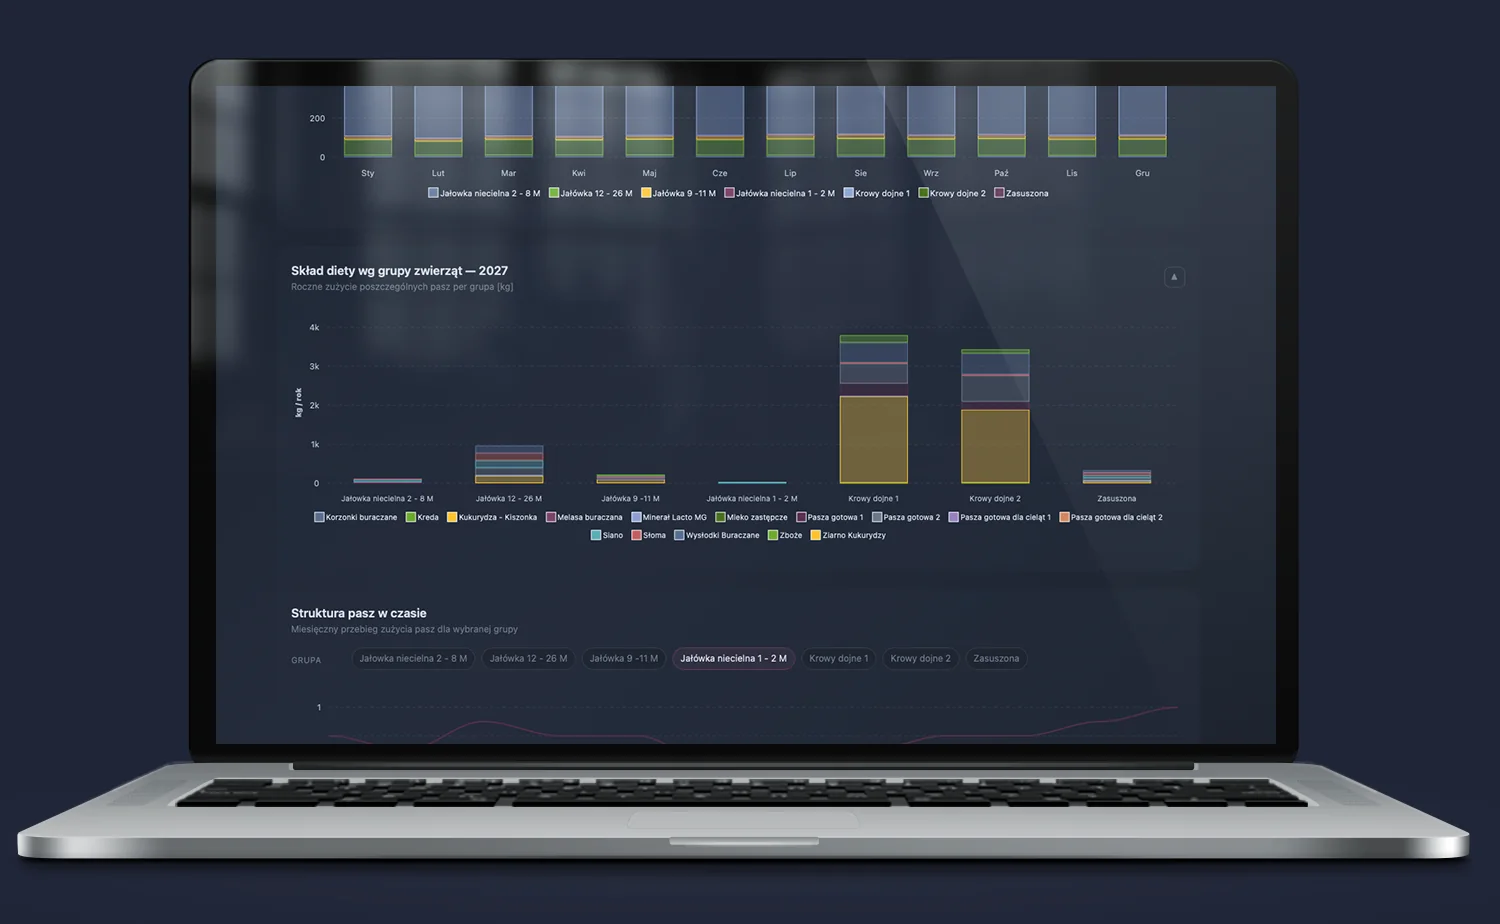
Seasonal feed demand is estimated by the agronomist from memory or last year’s data — without taking into account the current herd composition and current milk yield broken down by feeding groups.
Wet events — herd diseases — are recorded in a separate spreadsheet. No one links them to cow productivity in the same period.
The owner and management operate on reports dated a week or a month ago. Decisions about feed purchases, contract sales, or machine investments are made based on intuition reinforced by selected numbers — not on the basis of a complete model.
What Iris changes
The system not only shows dry results — it allows instant drill-down through all three data layers simultaneously. You see a deviation in milk production? You click and go down to the level of a specific month, lactation cycle, and animal group — and next to it you see what they were fed during that period. You see that the cost of producing rapeseed is higher than the purchase price? Iris shows exactly which plot and which cost item the problem lies in.
System architecture — three data sources, one picture
Demeter — financial-operational model (Excel + Clio)
The computational core remains the precise financial model in Excel — Demeter — which maps the full physics of the farm: DCF, three financial statements (P&L, Balance Sheet, Cash Flow), CapEx, revenue structure, operational costs (OpEx), dairy and crop production broken down by years and months. The Clio engine automatically aggregates data from the calculated model and loads it into a structured database — preserving history and versions across years.
Gaia — operational field and logistics registration
Gaia records every field activity (who, with what, on which plot, when, how much), every harvest logistics run (date, plot, crop, quantity, load level, operator, vehicle, warehouse) and every crop production event. The agronomist keeps their spreadsheet as before. Clio automatically pulls Gaia data and combines it with the Demeter model — creating operational views that do not exist in any separate system.
Hebe — dedicated dairy analytics
Hebe is a separate system layer focused exclusively on dairy production. It aggregates data on milk production broken down by lactation cycles, laboratory sample results (fat %, protein %), daily and monthly deliveries and purchase prices, feeding parameters by animal groups, herd health (wet events), and milk production costs. The data goes to Clio and becomes available in Iris alongside financial data from Demeter and operational data from Gaia.
Iris — React visual layer
Iris connects to the Clio API and renders data from all three systems as interactive dashboards. Accessible via browser — on phone, tablet, and laptop — without installation, without VPN, without opening a file. Every dashboard has XLSX, PDF, and JSON AI export with one click.
Dashboard catalog — what Iris visualizes
Milk Production Costs — operational-financial compass of a dairy farm
Most agricultural systems report the past.
This view automatically consolidates production and zootechnical data, turning it into a tool for forward-looking decisions. Instead of manually combining tables, management receives an immediate answer about herd profitability.
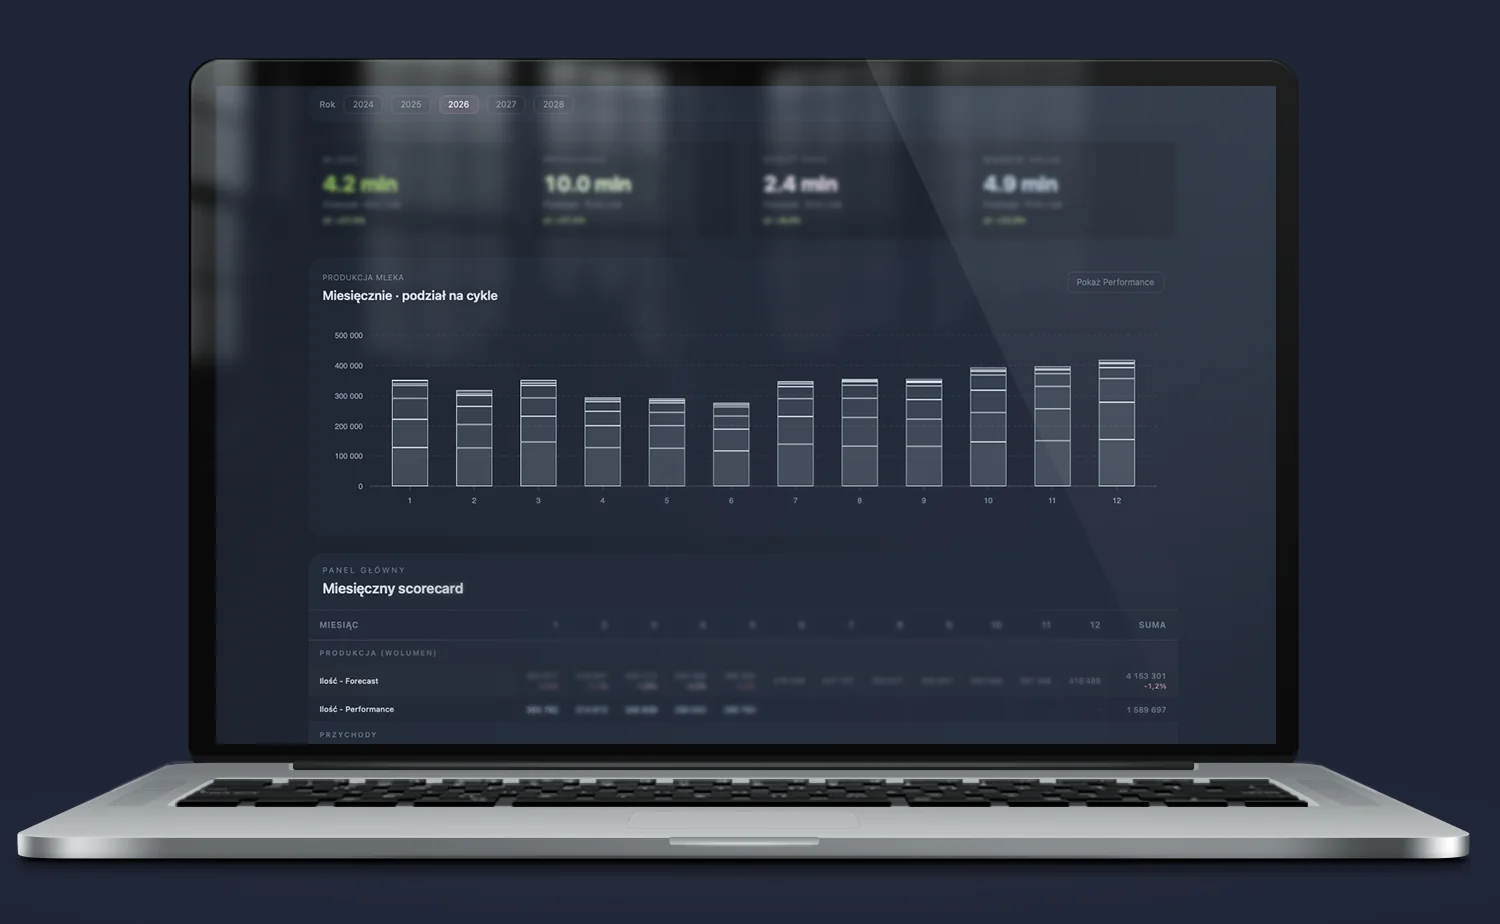
Early detection of herd anomalies (Lactation Structure): Breaking down monthly production into lactation cycles (Cycle 1–7) directly verifies herd renewal efficiency. A drop in performance in key cycles is visible immediately, not only in the quarterly financial result.
Automatic assumption audit (Forecast vs Performance): The monthly scorecard removes the need for traditional controlling to search for deviations. The system itself indicates whether production, herd structure, or market price per liter is diverging, providing dynamic year-over-year (YoY) context.
Crop Production Costs — absolute audit of sowing profitability
Moving from simple field cost recording to multi-variant financial engineering.
This module consolidates scattered machine, agrotechnical, and material costs, reducing them to one key decision unit: the real cost of producing one ton and the net EBIT result.
True profitability picture (Subsidy drip verification): The function of comparing results with and without subsidies immediately reveals the market condition of individual crops.
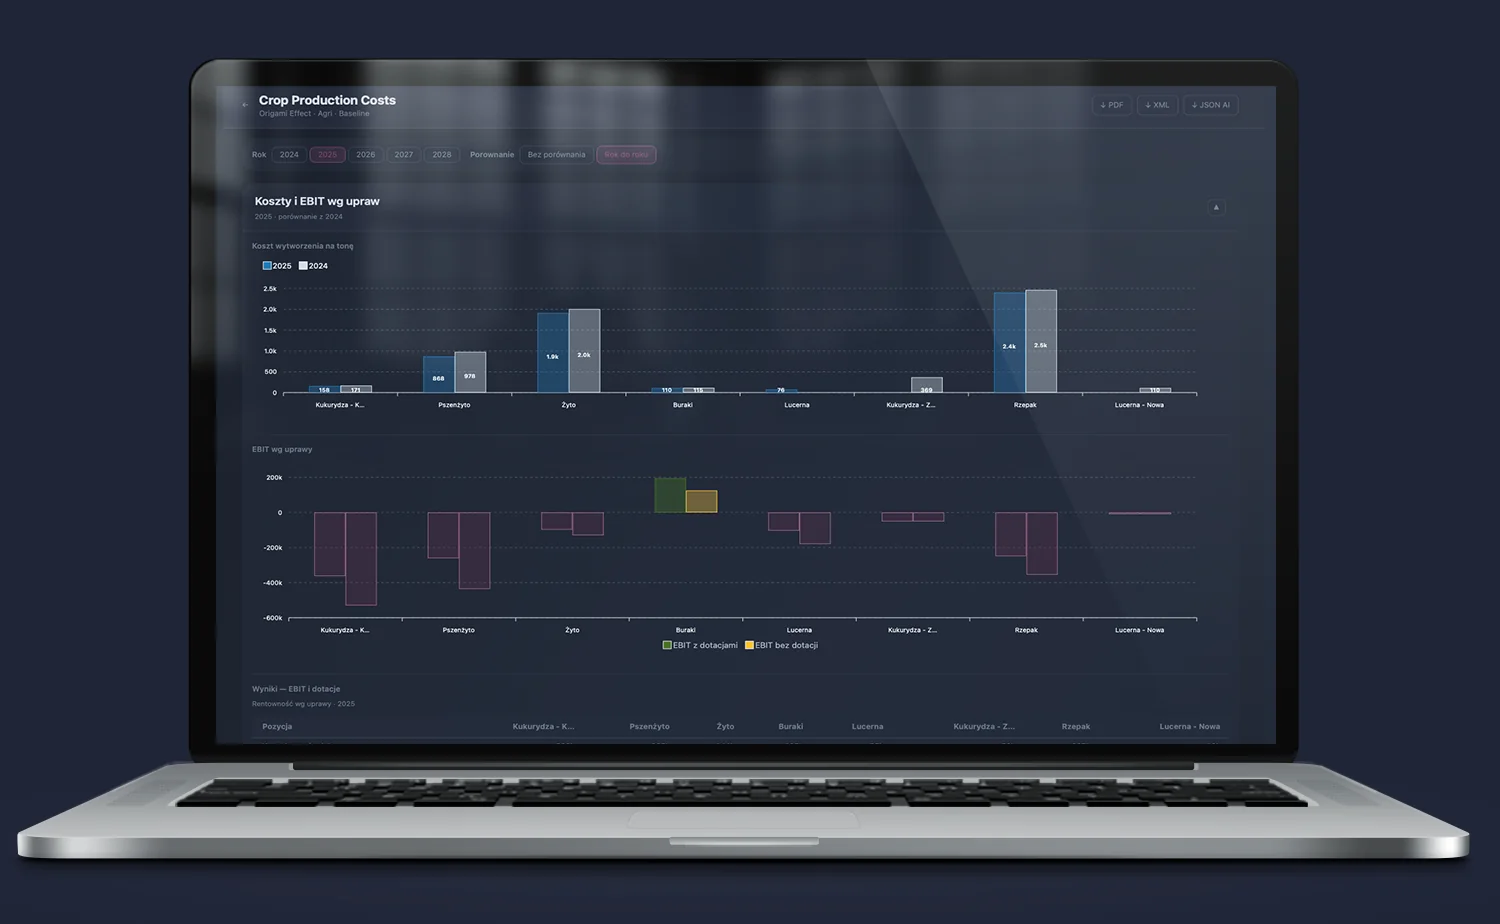
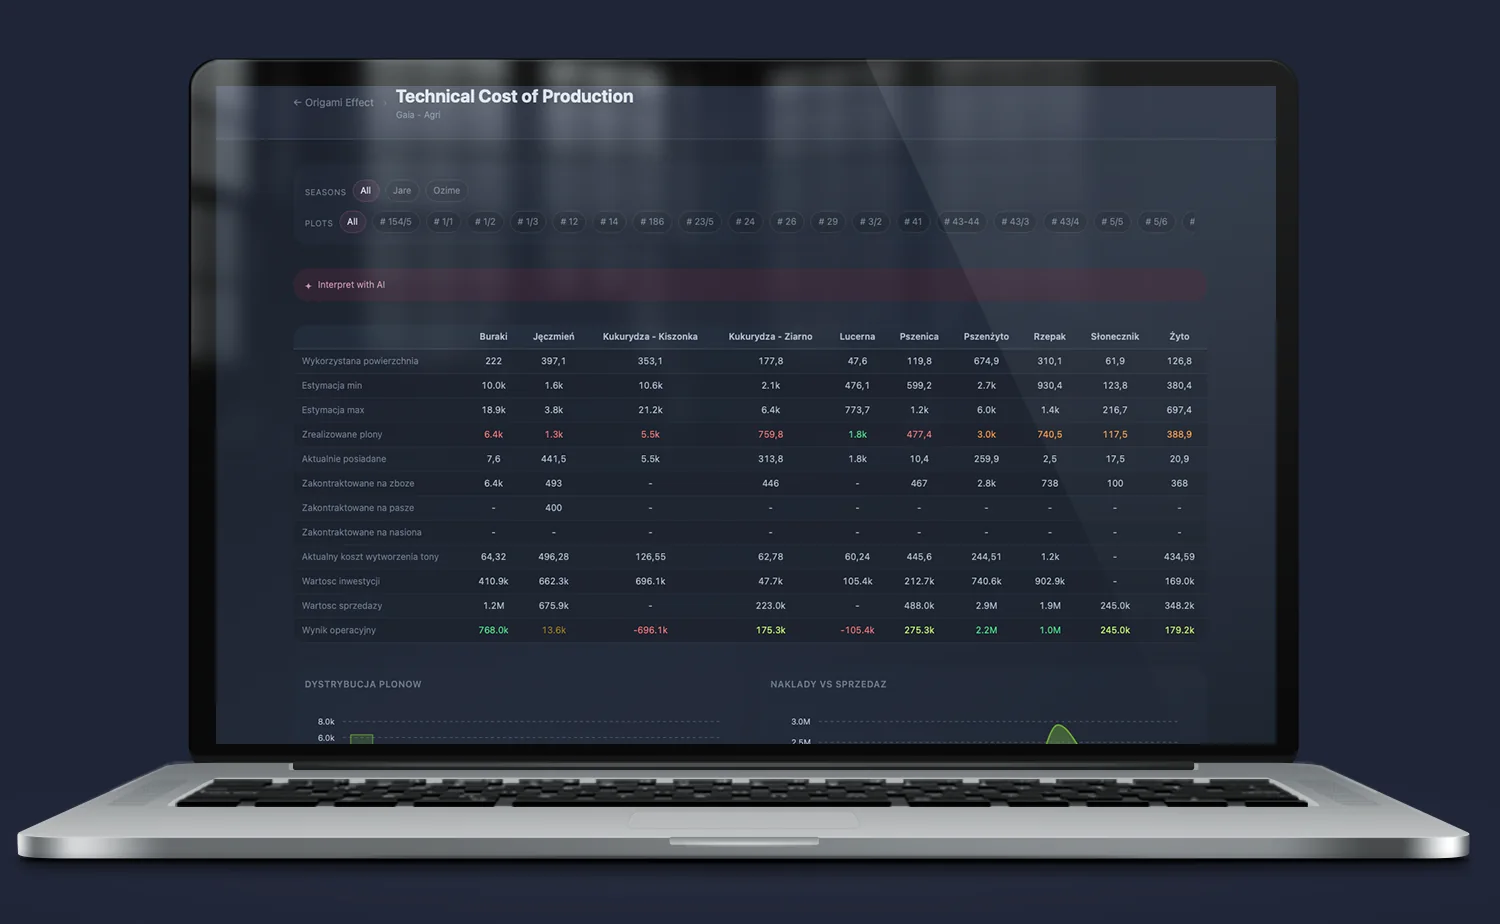
Precise unit cost benchmark (PLN/t): The system converts total operational input into the cost per ton of finished yield (from 57 PLN/t for Lucerne to 1.5k PLN/t for Rapeseed). This gives management clear information on exactly where the break-even point lies amid dynamic commodity market price changes.
Trend geometry (Dynamic sowing structure control): Automated year-over-year (YoY) analysis eliminates the error of weather anomalies from a single season. Instead, the trader and agronomist see long-term margin dynamics, allowing sowing structure design based on real profit rather than historical habits.
Performance vs Target (OpEx) — automatic feedback loop between budget and reality
The end of dead budgets in spreadsheets and postmortem accounting analysis. This module is the central controlling node that automatically closes the loop between prediction and execution.
The system collides hard operational data and invoices with operational targets set by the simulator algorithms in real time.
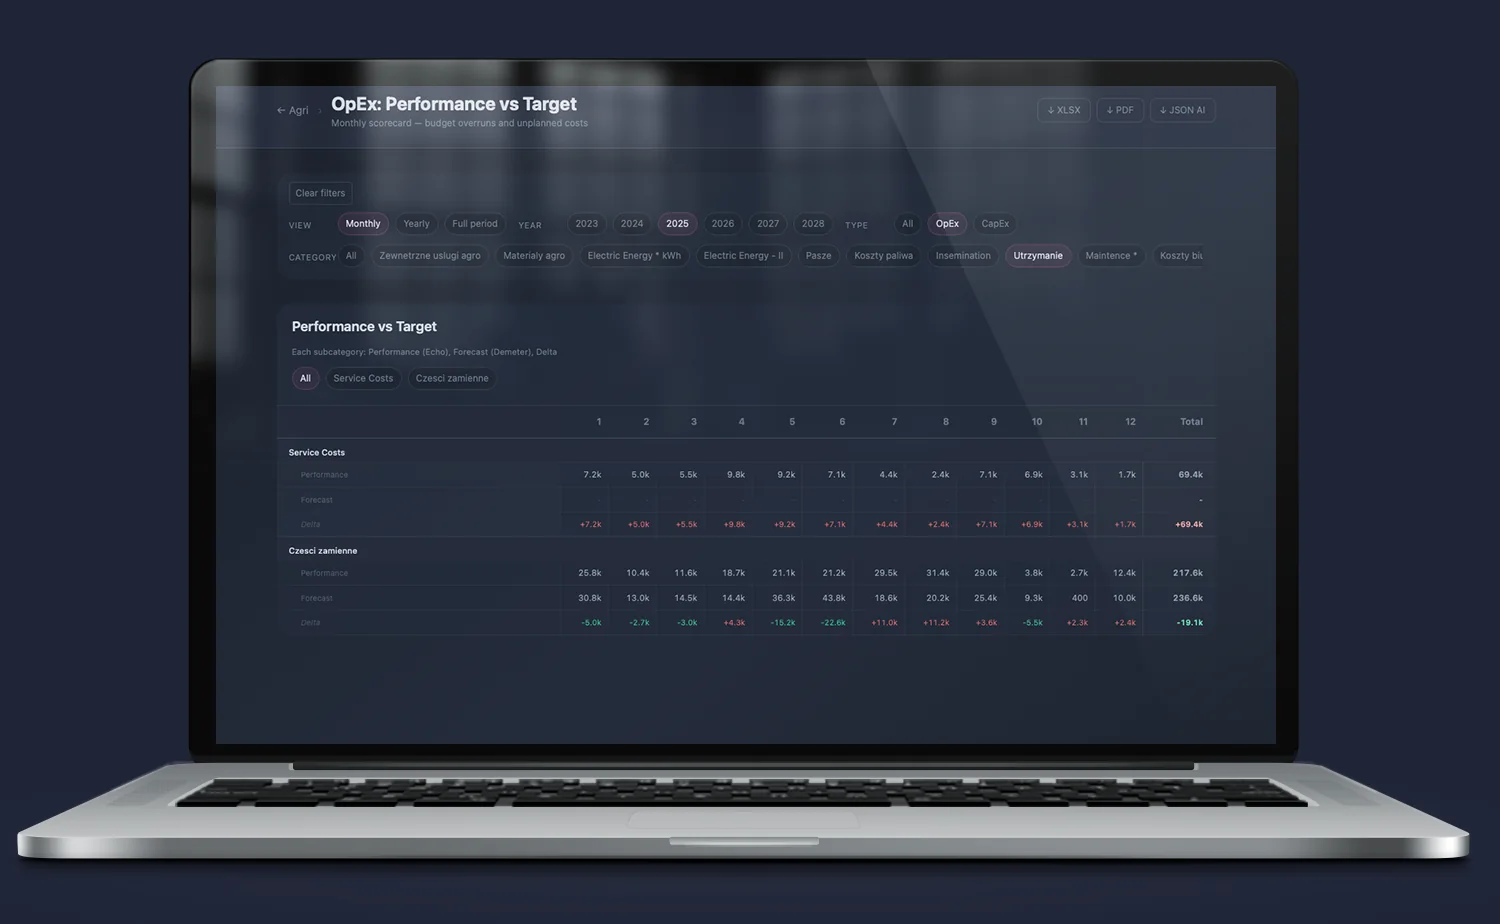
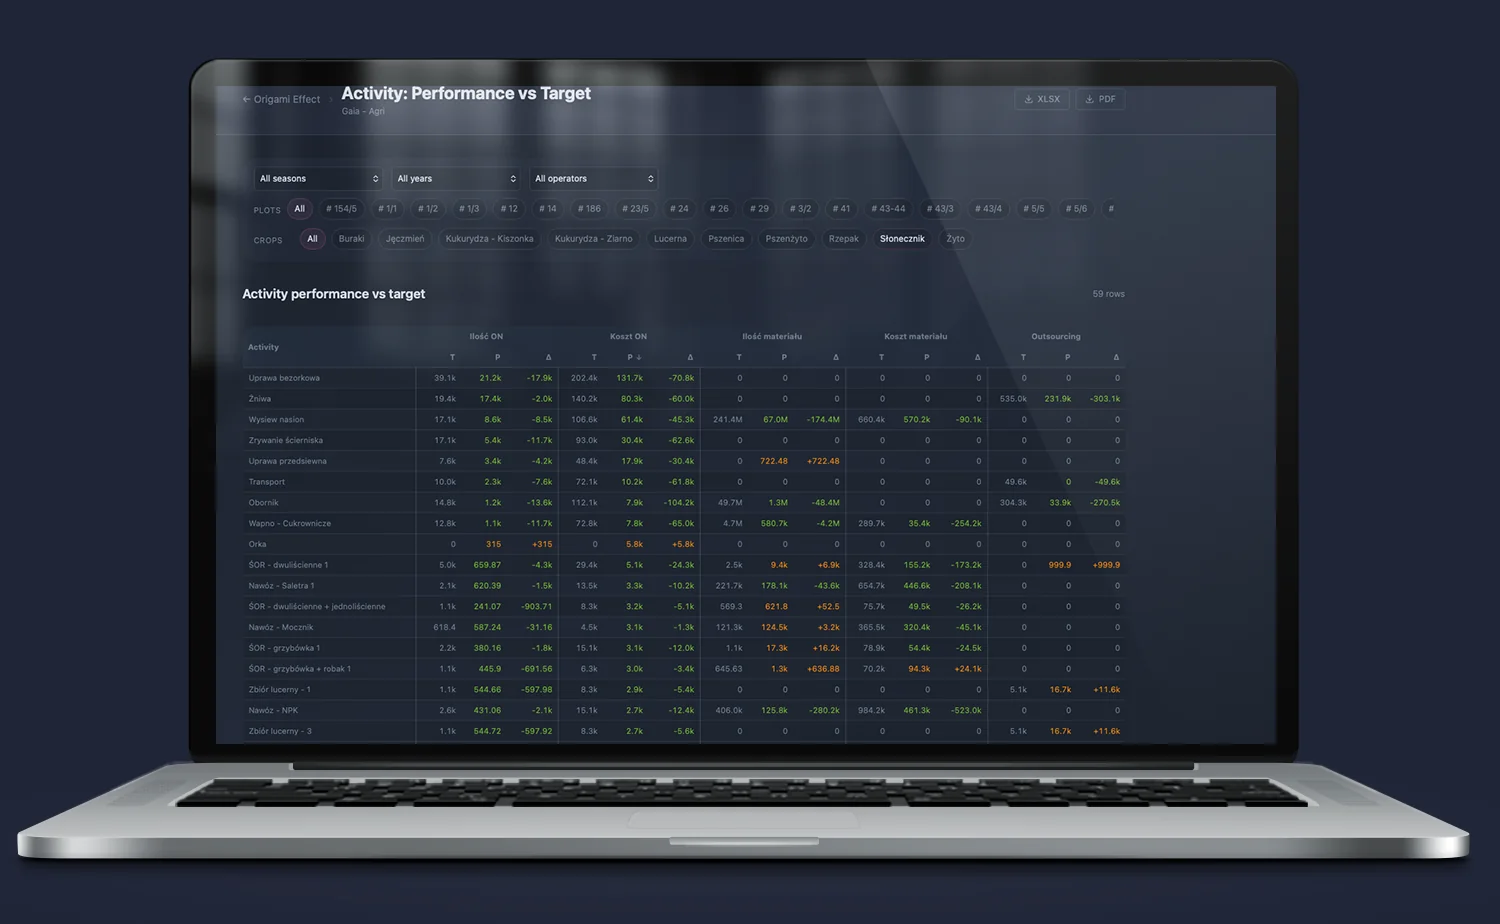
Automatic detection of cost anomalies (Intelligent Delta): Management does not have to analyze dozens of items themselves. The system automatically maps and aggregates deviations in key areas (from fuels and energy, through services and agro materials, to feed and zootechnics), immediately pointing out underestimations or areas where the budget is being burned.
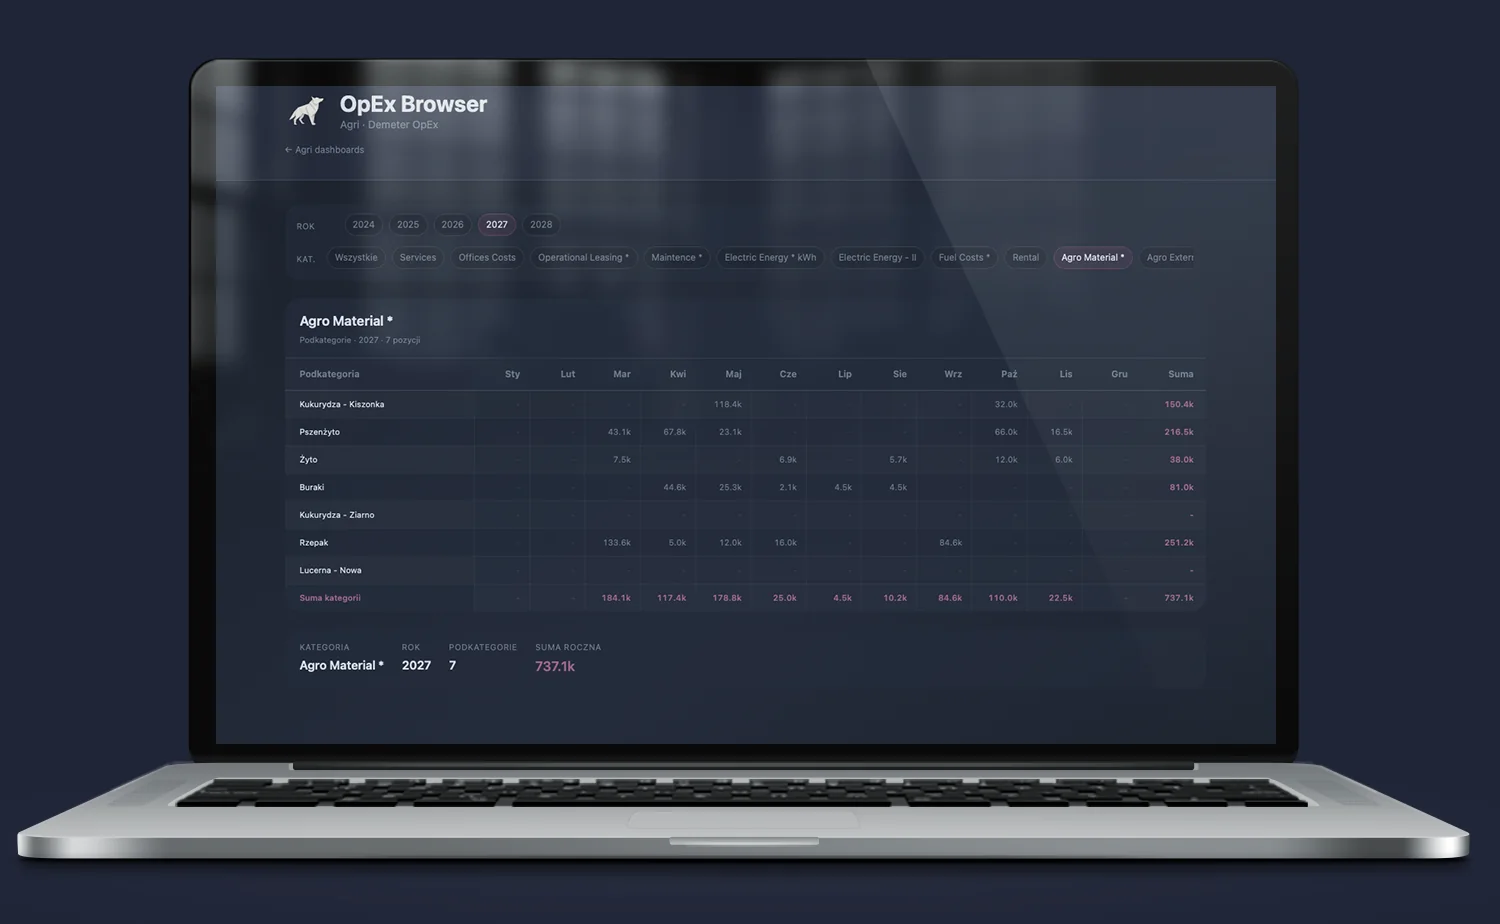
OpEx Browser — immediate analytical sovereignty of the financial department
Traditional controlling often breaks down due to time: detecting cost anomalies triggers a cascade of emails, calls to accounting, and multi-day waits for ERP extracts.
This interactive browser completely eliminates these frictions, giving managers direct, unrestricted insight into the company’s cost architecture in real time.
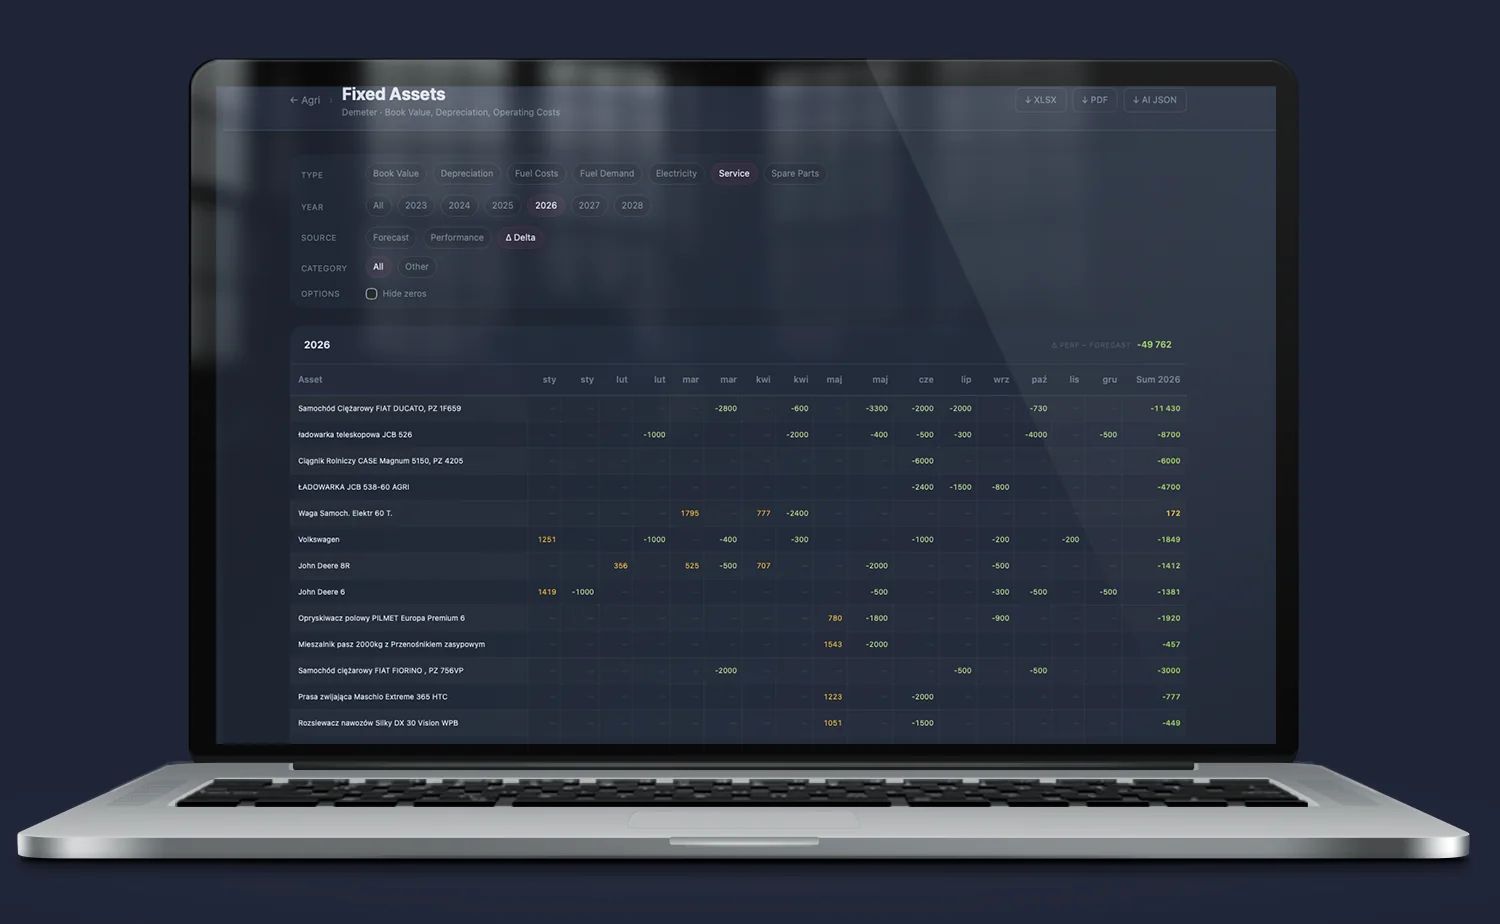
Fixed Assets — dynamic model of efficiency and machinery fleet costs
In most companies, the fixed assets register is a dead tax document. This module turns it into a living, two-way asset optimization system.
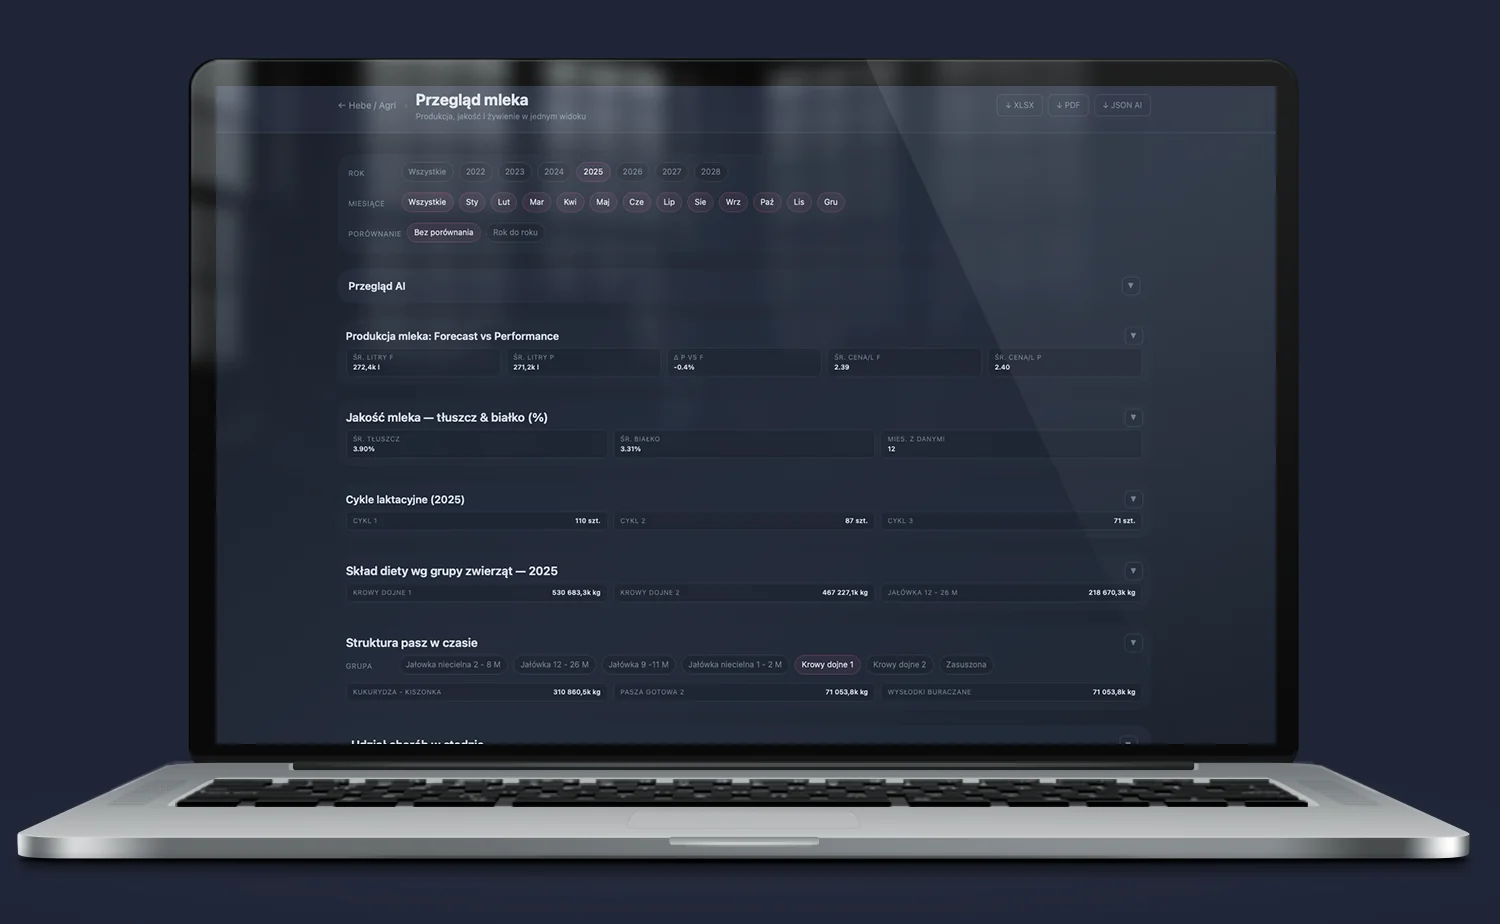
Hebe: Milk Overview + AI — multidimensional engineering of production and herd feeding
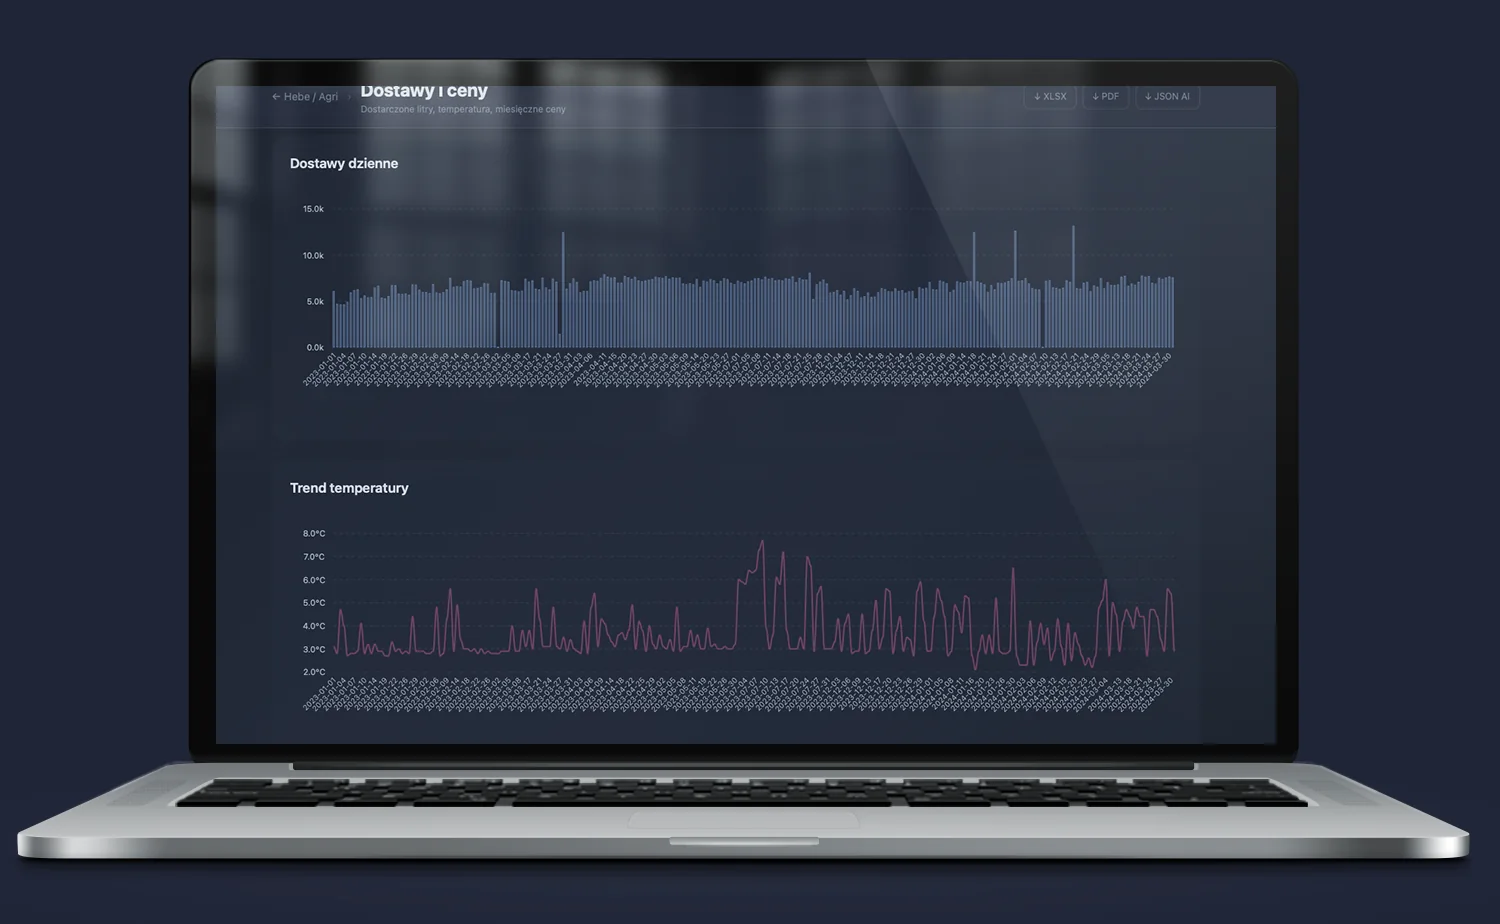
Hebe: Deliveries and prices — operational and commercial guardian of milk contracting
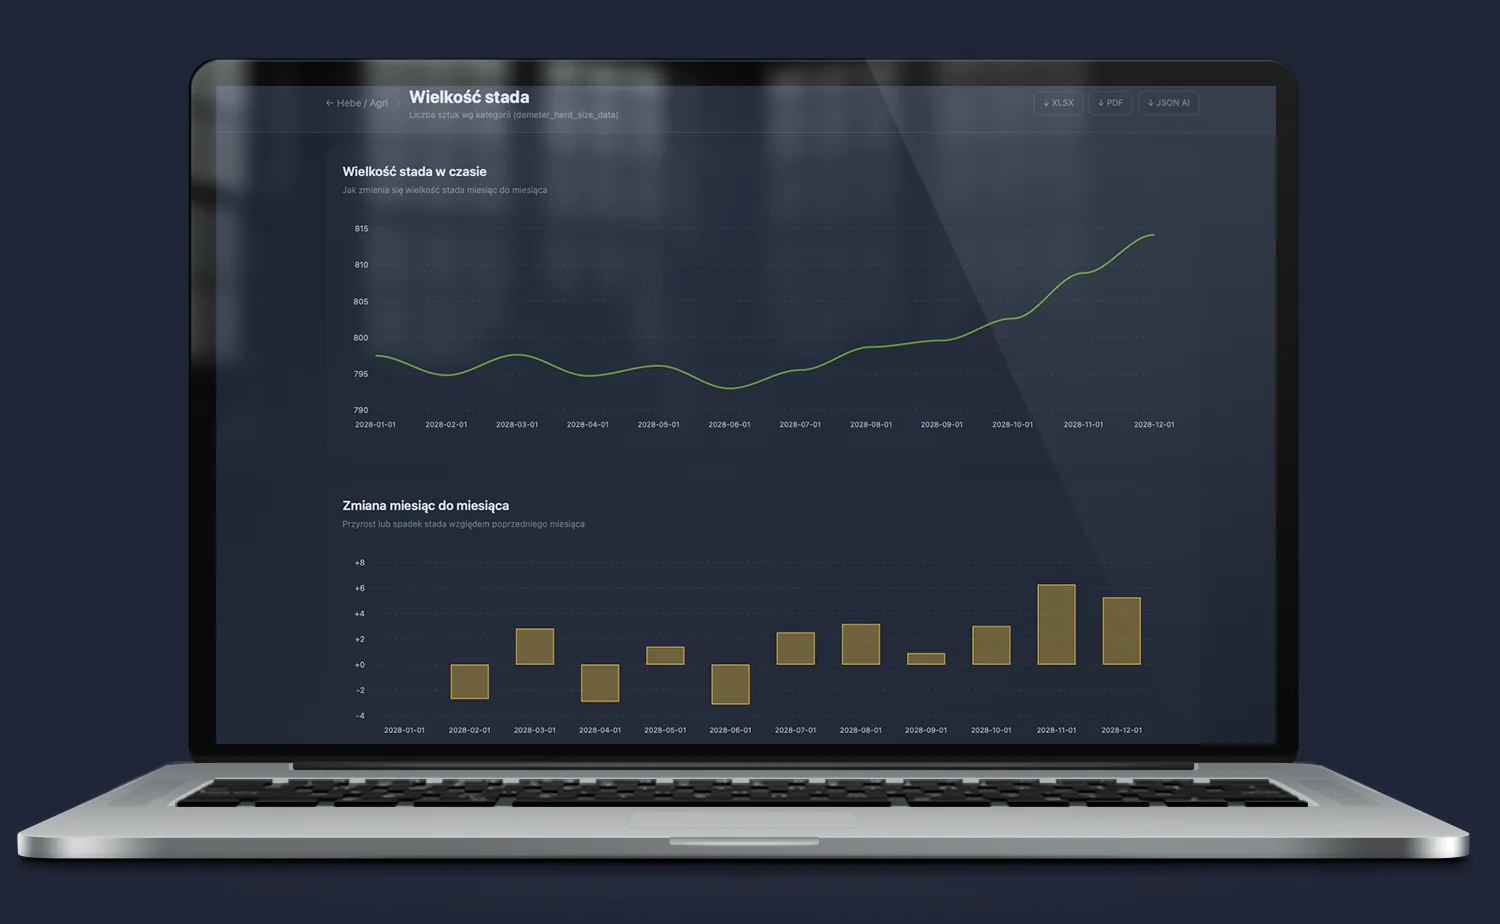
Hebe: Herd size — dynamic control of structure and production potential
Hebe: Feed consumption — precise audit and optimization of herd feeding costs
Gaia: Technical Cost of Production — margin per ton from every plot
Gaia: Activity Performance vs Target — operational verification of field costs
Implementation effects — what changes in practice
- The owner opens the dashboard in the morning before the barn on their phone. Sees yesterday’s milk production, current purchase price, and deviation from plan — without opening a file, without asking the zootechnician.
- Margin per ton from every plot — without manual summaries. Information that previously required a week of analyst work is available immediately — automatically combined from three data layers.
- Decision on crop structure based on hard numbers. Iris shows which wheat plots made money last season and which generated a loss. The decision to change the structure for the next year is based on data — not the agronomist’s memory.
- Milk quality as a management indicator, not just a laboratory one. Fat and protein trends seen alongside feeding costs and purchase results — in one view — allows optimization of herd diet with precision no spreadsheet can provide.
- Wet events in the context of productivity. Correlation between herd diseases and milk yield in the same cycle — visible without manual data combination.
- Transparency for the bank and investors. Full financial structure of the farm — DCF, P&L, Cash Flow, CapEx, plan vs. execution — available in a clean interface. One click generates a PDF or JSON AI export for a bank or auditor meeting.
- The agronomist and zootechnician do their job. The rest happens automatically. Gaia and Hebe record data as a natural result of operational work. Iris turns this data into a management picture without any additional reporting step.
Technology
Technology Layer
Financial model: Demeter (Excel)
Dairy analytics: Hebe (Excel + external laboratory sources)
Operational registration: Gaia (Excel, API)
Data aggregation: Clio (Python, MySQL)
Visual layer: React, Recharts, D3.js
AI layer: Claude API (Anthropic)
Export: XLSX, PDF, JSON AI with one click
API: REST, JSON
Hosting: Cloud, responsive (phone / tablet / desktop)
Data update: On every change in the model or operational registration
FAQ
How does data from the three systems get into one dashboard?
Clio is the central aggregator. It automatically pulls data from the Demeter model (Excel), Gaia registers, and Hebe data, cleans it, and loads it into a structured NoSQL database.
Iris connects to the Clio API and renders data from all three layers simultaneously. The user does not see this complexity — they see one coherent picture.
Do I have to change the way the agronomist or zootechnician works?
No. Gaia and Hebe record data in spreadsheets in a way that is natural for the people who keep them. The change does not concern the data entry process — it concerns what happens to the data afterward. Iris turns this data into a management picture without any additional reporting step.
Does Iris work on a phone?
Yes. Iris is built in React with a responsive layout. The owner opens the dashboard on their phone before going to the barn — the view is identical to the one on the office monitor.
How many dashboards does the system have?
In the presented configuration: 7 Demeter dashboards + 9 Hebe dashboards + 4 Gaia dashboards.
The system is extensible — every new data area can get its own view.
Do you need someone who instantly understands the problem — and knows what to do with it?
Most companies have data. What’s missing is the idea of what to do with it — and someone who will actually execute it. Origami Effect provides both.