Reporting and controlling systems that drive decisions, not chaos.
Strong reporting does not describe the past. It gives management and owners an advantage for the next quarter.
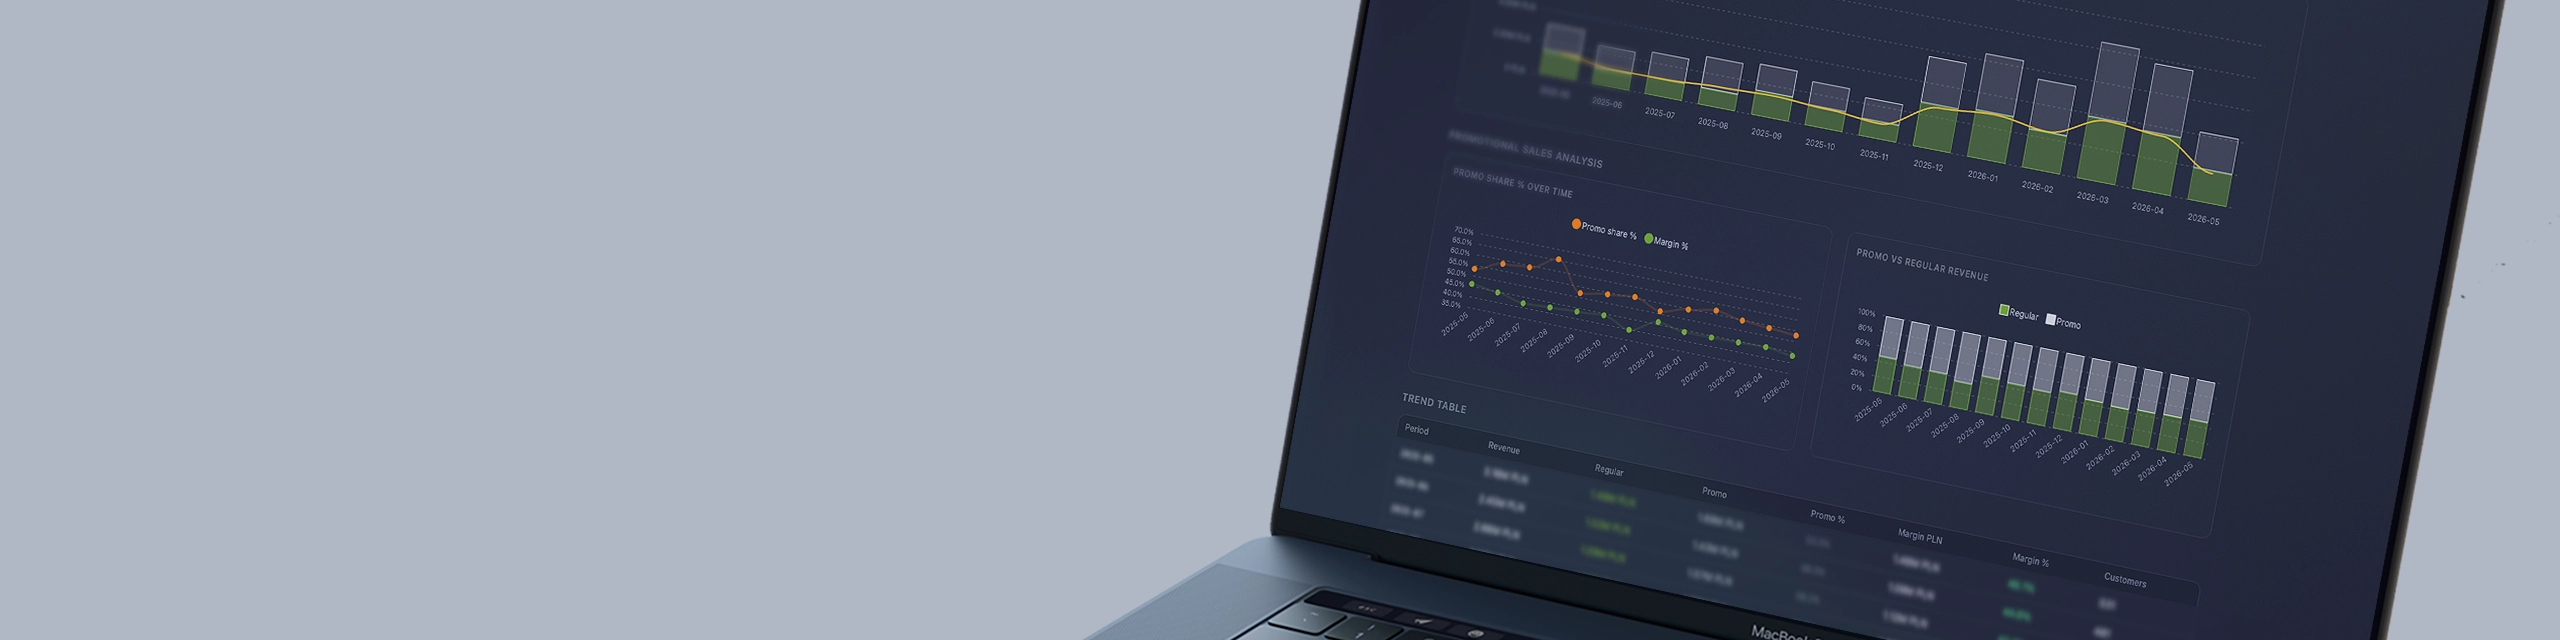
Origami Effect combines operational and financial data into one controlling system: from invoice, through margin, to cash flow and what-if scenarios.
What does management expect from a reporting system?
Visibility
- one version of truth for finance and operations
- a clear plan vs actual KPI view
- insight into profitability by customers, products, and channels
Fast reaction
- alerts on deviations before issues escalate
- a weekly decision rhythm, not a quarterly description
- an immediate answer to: what if?
Execution
- clear KPI ownership in teams
- automated reporting without manual assembly
- clear priorities for the next operational sprint
How we design a controlling system
Decision map
First, we define the decisions that should be made using data. Only then do we choose KPIs, data sources, and reporting formats.
Driver-based model
The system is built on business drivers: volume, price, unit cost, productivity, and capital turnover.
Data flow automation
Data from ERP, CRM, Excel, and operational sources is synchronized automatically, and reports reach the right people on time.
Business impact after implementation
The leadership team works from the same view of the company: margin, liquidity, inventory, CAPEX, and plan execution. The debate about which numbers are true disappears.
Controlling stops being report production and becomes a decision mechanism based on facts and scenarios.
Example implementations
Organize controlling and reporting in your company
Briefly describe your current situation. Origami Effect will propose data architecture, KPI logic, and a reporting cadence tailored to your business model.
FAQ
How is this different from a classic monthly report?
A monthly report describes the past. The Origami Effect controlling system supports current decisions by showing deviations and root causes during the month.
Does implementation require replacing ERP?
No. In most cases, we integrate existing data sources and build the reporting layer on top of your current environment.
Who is this for?
For organizations that want faster decisions on margin, liquidity, costs, and growth, instead of only closing accounting periods.
How quickly can we see results?
Initial results usually appear after launching a core KPI set and a plan vs actual report for the key business areas.