


Data warehouse for a car importer
Orbis is a modular data and automation system for a car importer. It connects sales, dealers, invoices, financing reports and operational documents into a single, coherent decision layer. Instead of multiple spreadsheets, exports and reports from different departments, a common model of the vehicle, transaction, margin and financing is created, which can be analysed from the level of a single VIN up to the entire sales portfolio.
This is not a single chart or one dashboard. It is an extensive catalogue of analytical and operational modules: sales, monitoring, financing, stock aging, margins, discounts, customer segmentation, warranty and registrations. The interactive React layer presents these analyses in a clear, transparent view for management, salespeople, finance and operations.
From dispersed data to a single picture of the business
A car importer works in parallel on data from the ERP system, sales files, financing reports, XML documents and materials shared in SharePoint. Each source describes only part of reality. Only by combining them is it possible to understand which vehicles are sold at the right margin, where capital remains tied up in stock, and how financing affects the result.
What reality looks like without a data warehouse
- Sales, accounting and the dealer network work on different exports and different refresh dates.
- Analysing a single vehicle requires manually linking the VIN number, invoice, financing terms and dealer data.
- Margins, discounts and rotation are examined separately, making it harder to find the real cause of a deviation.
- A report becomes outdated before it reaches the person who is supposed to take a decision.
What the system changes
Every import normalises data to a common schema and builds a history on which periods, dealers, brands, models and financing channels can be safely compared. The VIN becomes the key that links commercial, document and financial data. The team operates on the same set of indicators, not on successive versions of the same file.
Data warehouse architecture
Source layer. The system retrieves sales data, invoices, ERP exports in XML, financing reports and reference data on dealers and brands. Documents can enter the process from SharePoint resources, so the file flow does not require manual transfer to a separate tool.
Processing and quality layer. The OCR parser extracts from invoices, among other things, document numbers, tax IDs (NIP), VINs, net, VAT and gross amounts, line-item descriptions and dates. Data are validated, and low-confidence records can be routed for review. ERP exports are transformed into a transactional model while preserving document provenance.
Data model layer. Common tables link sales, dealers, invoices, financing and vehicle data. The model covers, among other things, prices, margins, discounts, technical parameters, statuses, customer segments and turnover history.
Analytical and React layer. Calculations run cyclically and results feed interactive React views. The user can filter data, compare periods and drill down from KPIs to the level of brand, model, dealer or a single transaction.
Analysis that supports operational decisions
The system does not stop at a sales summary. It acts as a continuous source of business insights: it shows which models are profitable, how long it takes to sell a vehicle from order to settlement, and where non-obvious deviations appear. In practice it covers the following areas:
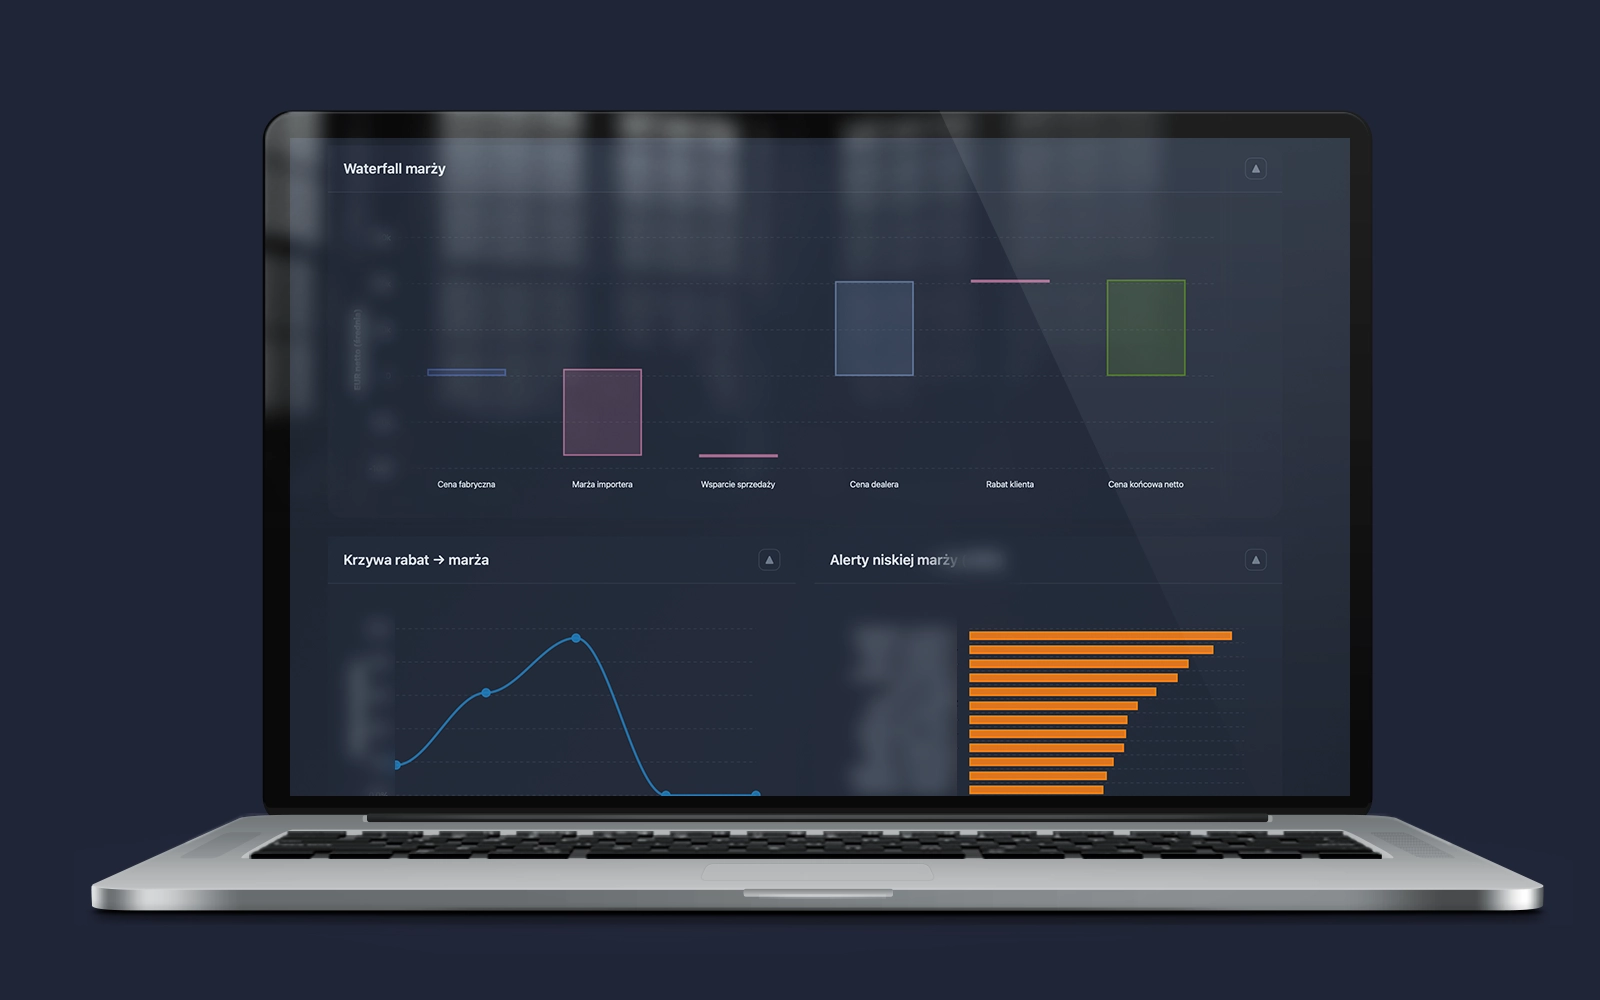
- Margins and discounts. It compares monetary and percentage margin per dealer, salesperson, brand and customer segment in order to distinguish high volume from sales that truly generate results.
- Model mix. It analyses the most frequently sold configurations: model, version, engine, gearbox, colour and equipment, which helps plan stock and purchase rates.
- Factory pipeline. It tracks the delivery forecast, arrival dates and backlogs between order and fulfilment in order to reduce the risk of shortages and unnecessary sales pressure.
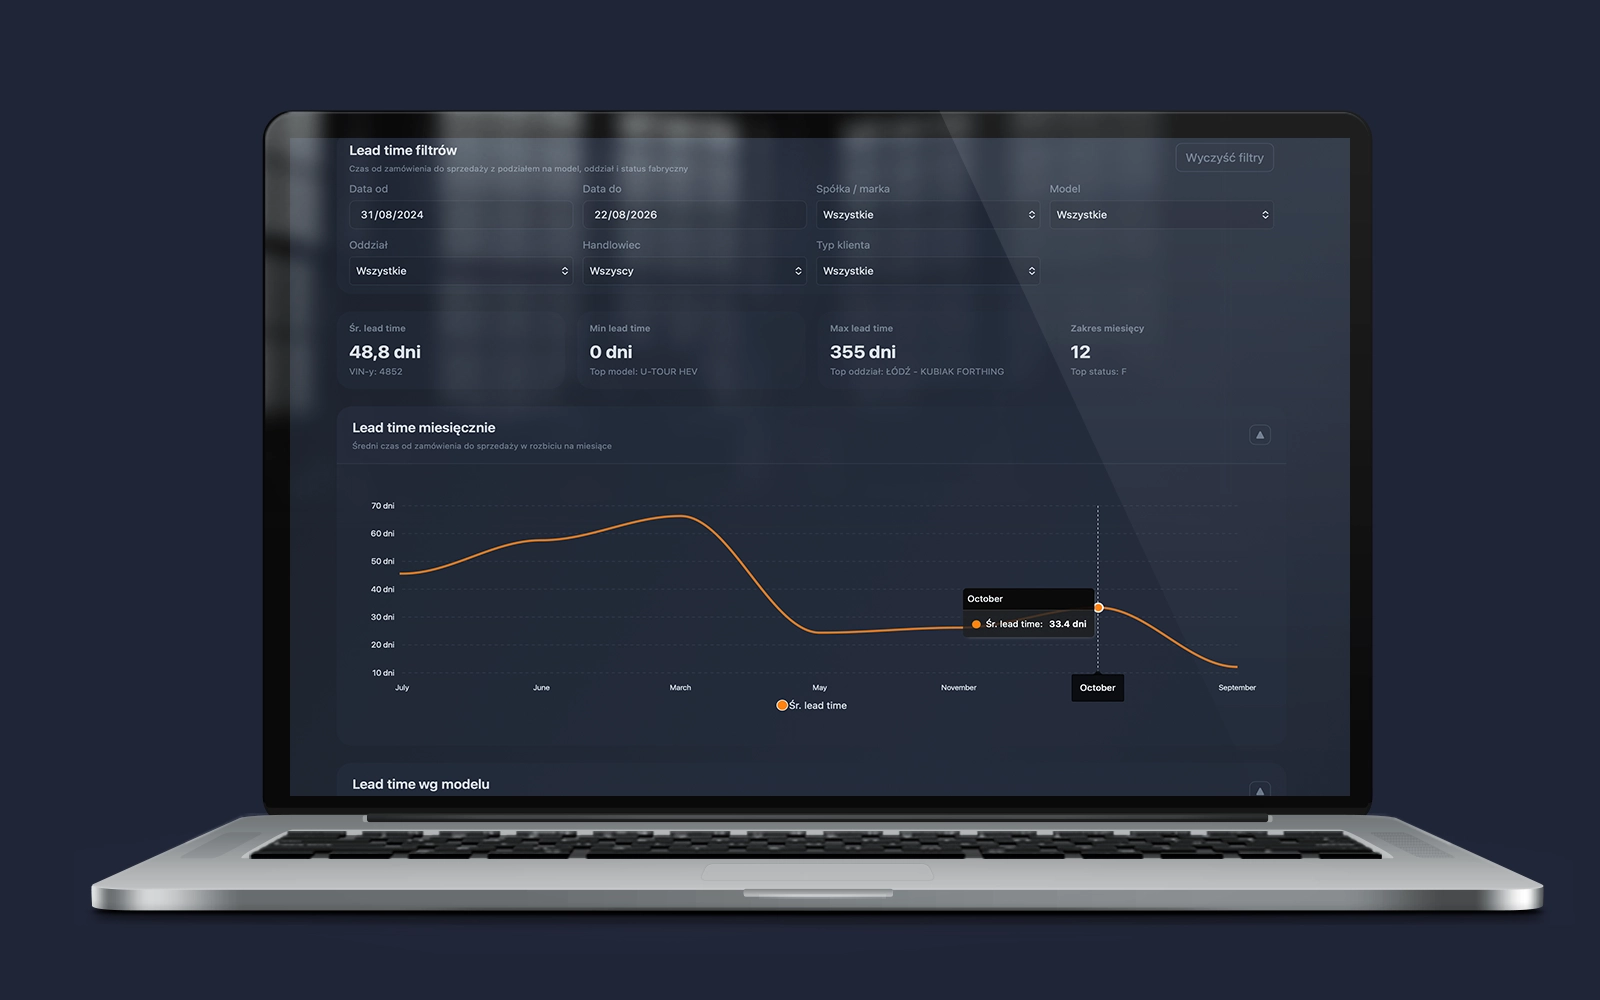
- Lead time and stock rotation. The system calculates the average time from order to sale and shows which models rotate more slowly. This makes it possible to identify cars sitting in the warehouse and models that require pricing actions, promotions or a sales-plan adjustment.
- Customer segmentation. It separates customers into B2B, B2C, fleet, rental and private individuals in order to compare profitability, sales structure and offer effectiveness on specific segments.
- Warranties and registrations. It monitors extended warranties, registration deadlines and delays between sale and settlement in order to distinguish ordinary delay from real operational risk.
- CO2 and price efficiency. It compares exhaust emissions, powertrain type and price efficiency across models and sales channels, supporting decisions on assortment and promotion policy.
In practice, data from the warehouse show not only “how much was sold”, but also how quickly it sold, what impact it had on the result and which segment has the greatest potential. This gives sales, finance and management a shared picture of the same business.
Automations embedded in the data
Automations do not run alongside the data warehouse. They use the same structured model, so their result can be traced back to the source document, controlled in analyses and reconstructed in the operational history.
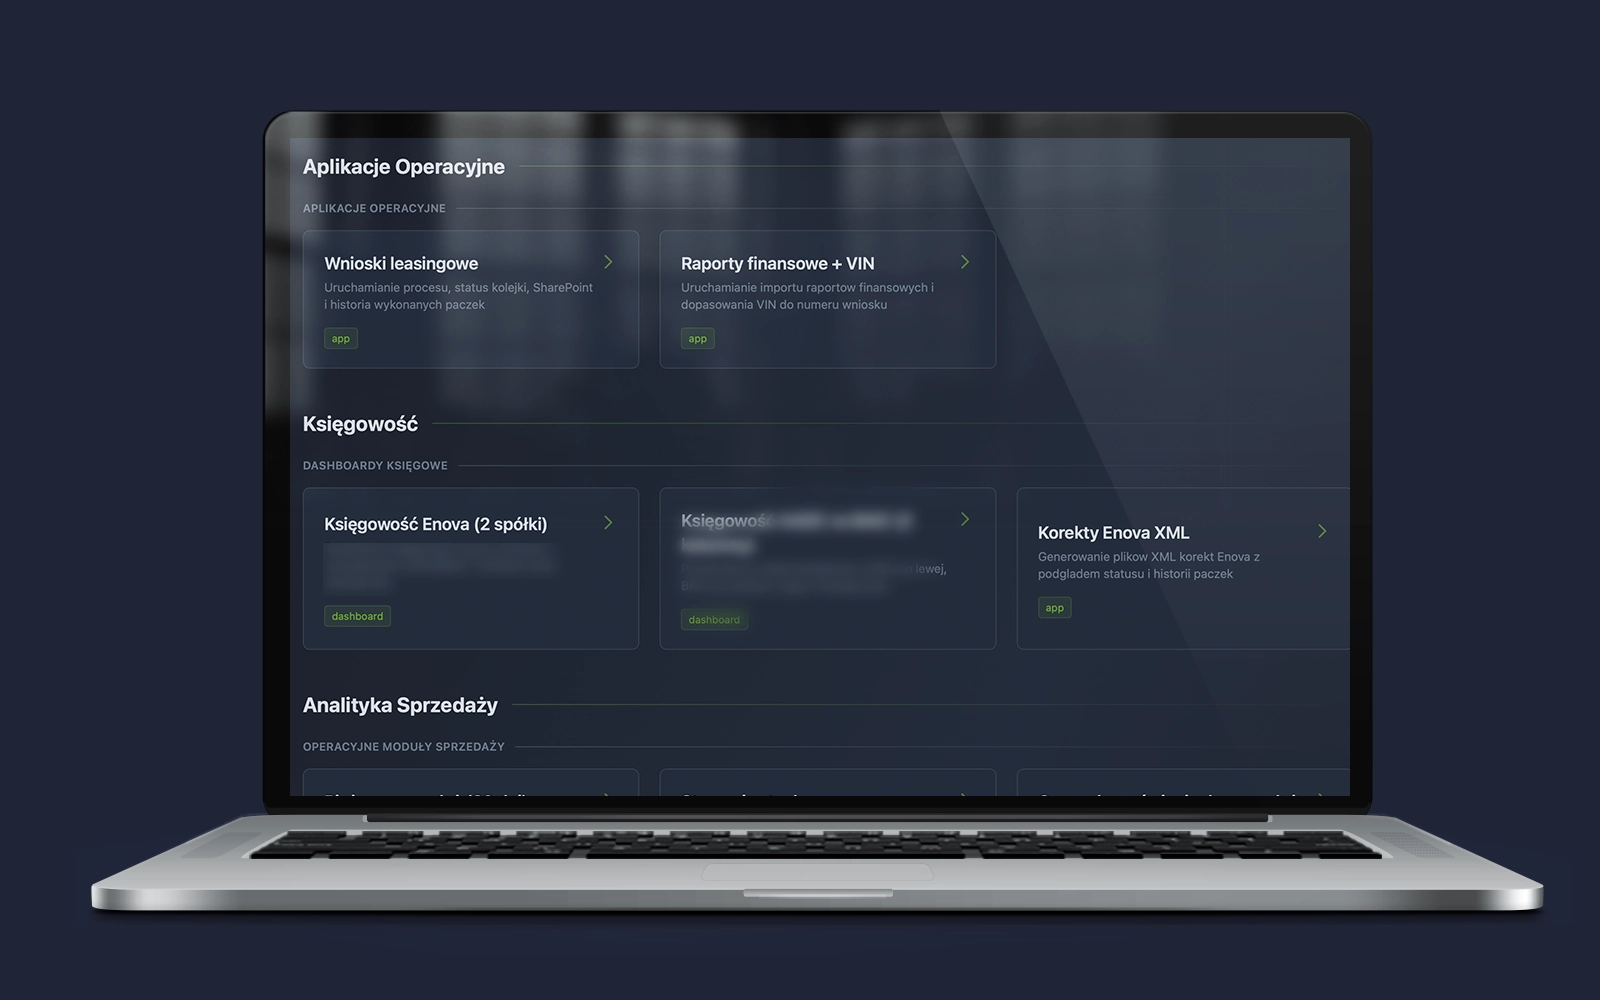
Generation of leasing applications
After processing an invoice, the system prepares a leasing-application file with vehicle data, price, sale date and VIN number. The dealer and contract number are matched on the basis of the VIN and, when necessary, also buyer data. The process reduces retyping of data between the invoice, the master record and the form. In addition there is an operational panel for monitoring task status, package history, the number of processed records and process execution time.
Preparation of invoice corrections
On the basis of sales data the system creates correction documents for agreed discounts and bonuses. It controls the sequence of corrections by VIN, retains the history of generated documents and eliminates accidental duplicates. Thanks to this a correction remains part of an auditable process, not a one-off file.
Monitoring and process observation
Document processing does not end in a single step. The system records the execution of imports, the status of file retrieval from SharePoint, OCR results and the final stages of generating applications and corrections. This allows the user to control the entire operational process without manually checking folders and spreadsheets in many places.
Technology
| Layer | Technology and role |
|---|---|
| Data integration | Python, SharePoint, Excel and XML file imports |
| Data warehouse | MySQL, relational data model for sales, dealers, invoices and financing |
| Document processing | OCR, PDF parsers, validation and normalisation of invoice data |
| Analytics | Pandas, predictive models and anomaly-detection rules |
| Visual layer | React, interactive dashboards and drill-down to source data |
| Automation | Task scheduling, generation of XLSX files and XML documents |
Effect: analytics instead of manual data merging
One model instead of many exports. Departments refer to the same definitions of sales, margin, vehicle and financing.
Decisions based on full context. Dealer result, stock, discount and financing can be analysed together, not in separate reports.
Document processes under control. Data for leasing applications and corrections are taken from a structured database, which reduces manual retyping and facilitates audit.
A view available to the business. React turns the data warehouse into an interactive interface in which a decision-maker can independently go from an indicator to the source of a deviation.
Operational data can work like a decision system
Origami Effect designs data warehouses and analytical layers so as to connect real operational processes with a clear view for the management team.