
Financial Analysis with Determination of Technical Cost of Production
Project goal:
Conducting an in-depth financial analysis of operational activities of a large agricultural farm, in order to:
- identify areas for efficiency improvement
- determine the Technical Cost of Production (TKW) for crop and livestock activities
Scope of work:
- Conducted historical financial analysis of the agricultural company, covering data from several years (including invoices, JPK, internal summaries).
- Defined direct costs for each business line: grain cultivation, milk production.
- Developed a TKW structure separately for crops and milk, with full breakdown of material, labor, machinery, fuel, energy, and depreciation costs.
Result:
- Prepared a consistent cost structure suitable for reporting broken down by activities and product lines.
- Identified actions that generated savings of over 350,000 PLN annually in one segment.
- Identified areas for efficiency improvement, including:
- inefficient debt financing structure
- excessive number of machines in relation to the cultivated area,
- overstated fuel consumption for selected crops
Cost and revenue analysis in crop production (historical report)
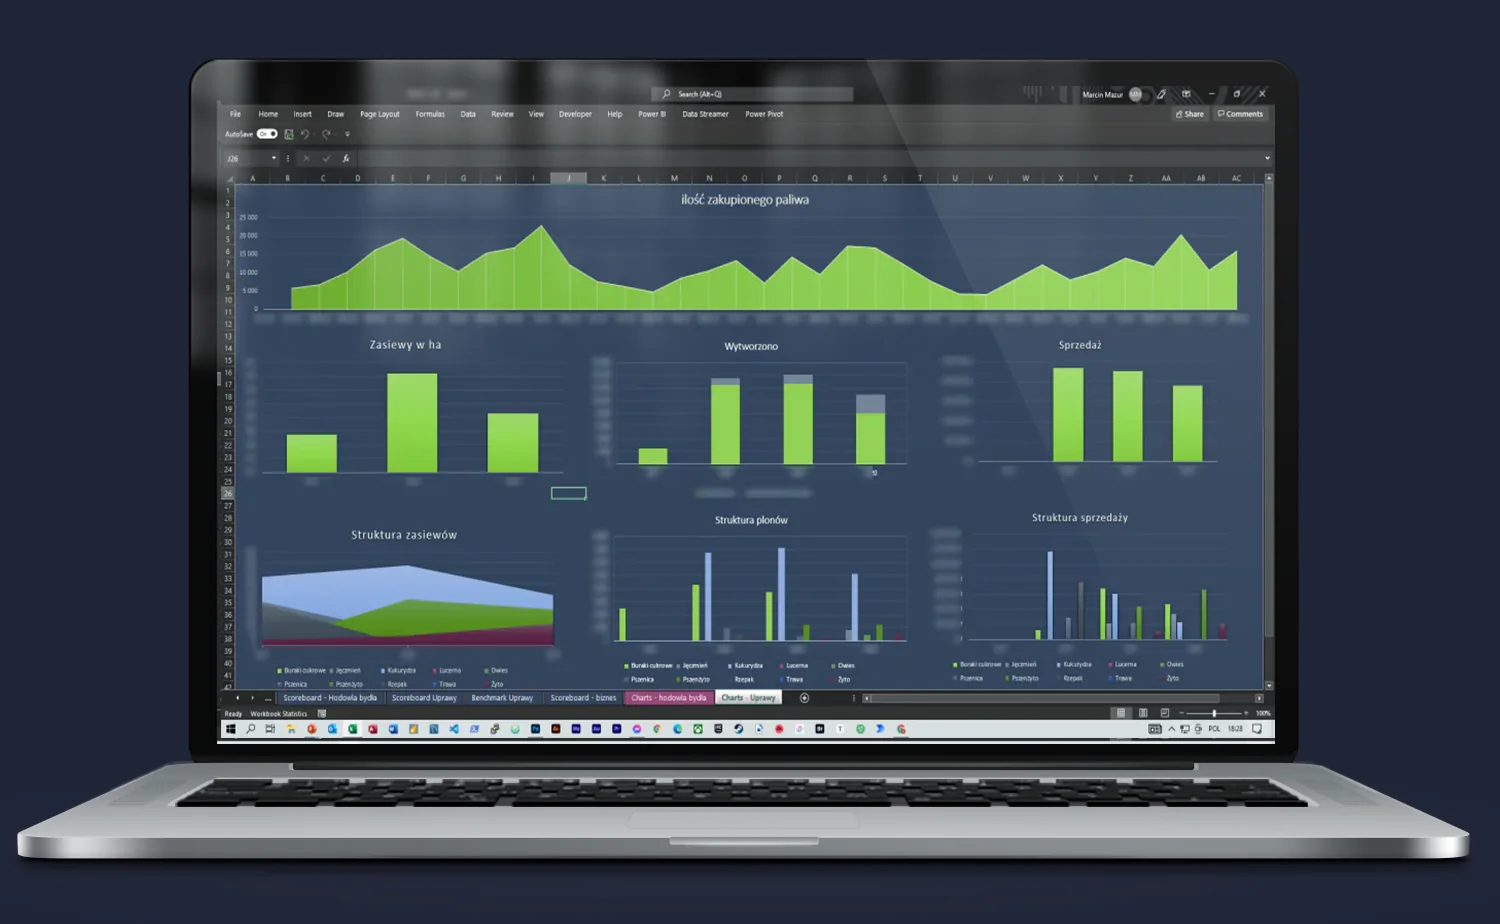
This dashboard was created as part of the historical cost and efficiency analysis of crop production in a large farm.
The purpose of the report was to examine the relationships between inputs (especially fuel consumption), sown area, harvest volume, and sales revenues.
Scope of analysis:
- Fuel consumption – a chart showing monthly fuel purchases over the entire analysis period, used to assess the intensity of field work and possible irregularities,
- Sowing and harvesting – data on cultivated area and actual yields in tons, broken down by key crop species,
- Sales revenues – summary of sales value obtained from different crop groups,
- Structure of sowing, yields and sales – visual assessment of the proportions between inputs and effects in the context of individual crops.
Conclusions from the analysis:
- Identified crops with disproportionate costs relative to economic results,
- Revealed potential inefficiencies in fuel and land management,
- The analysis served as the basis for recommendations on changes in crop structure and planning of field work in subsequent seasons.
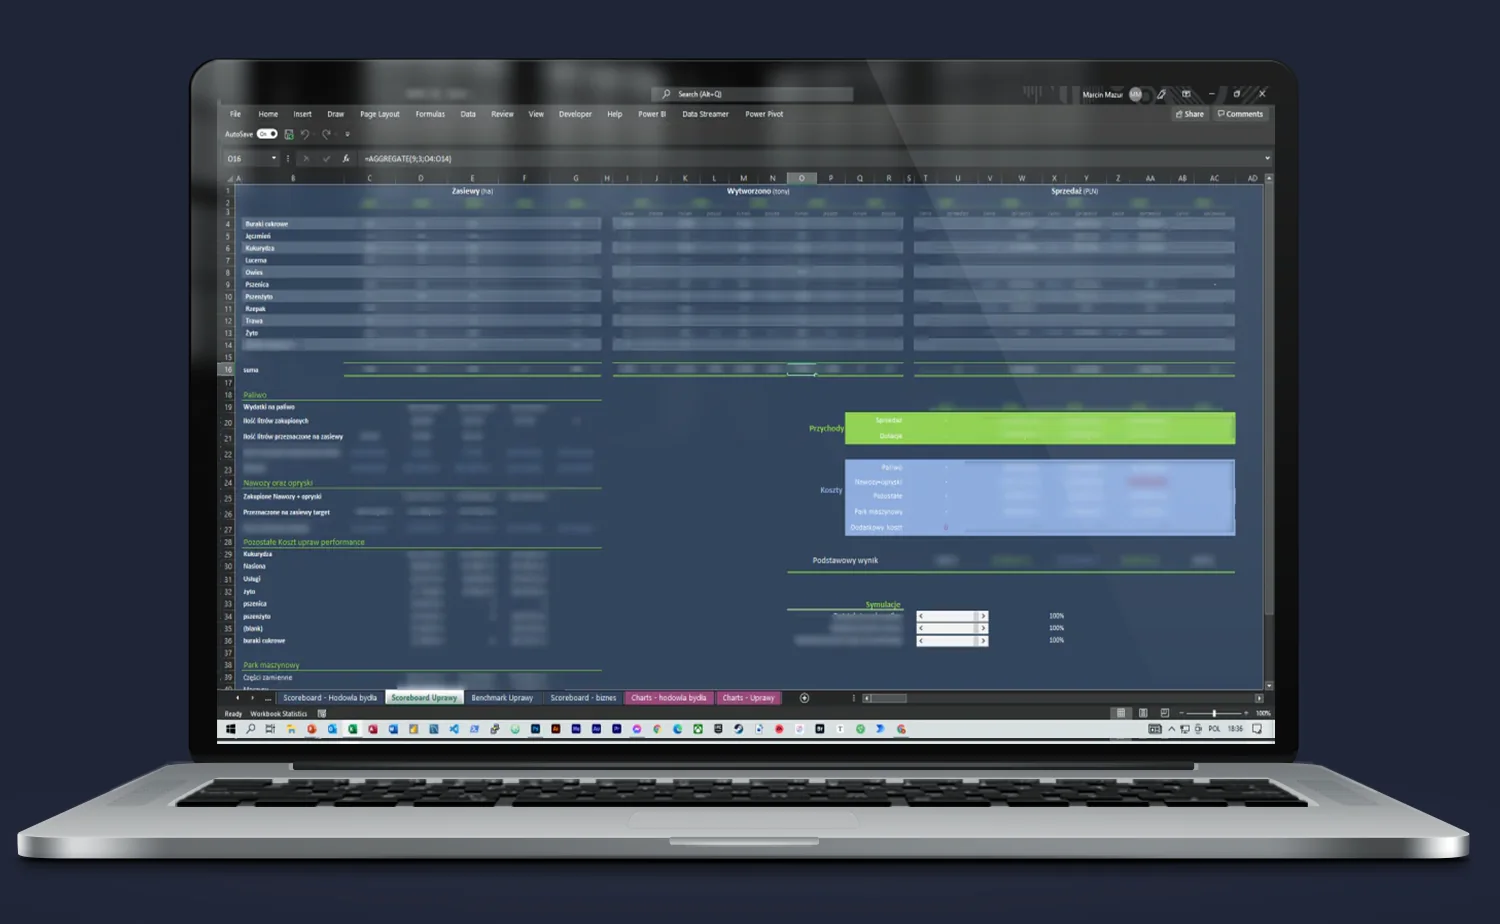
Financial analysis dashboard: Crop production – costs, revenues and profitability
A dashboard created as part of the historical analysis of crop production. It enables assessment of the economic efficiency of individual crops in a full seasonal cycle – taking into account both costs and revenues.
Scope of analysis:
1. Summary of sowing, harvest and sales data for over a dozen crops (e.g. wheat, rapeseed, corn),
2. Breakdown of costs into key groups: fuel, fertilizers, plant protection products, machinery fleet and other variable costs,
3. Automatic calculation of:
- unit and total costs,
- operating margin (per ton and hectare),
- resource consumption per hectare,
4. Calculation of the basic result from the entire crop activity,
5. Built-in simulations of the impact of changes in purchase prices, costs and yields on the economic result.
The dashboard was part of a larger report that allowed identification of crops with too low margins and overstated technical costs.
Financial analysis dashboard: Milk production – costs, revenues and result.
This dashboard presents aggregated financial data from milk production, prepared on a quarterly basis for a one-time analysis of efficiency and cost structure in dairy cattle breeding.
Scope of analysis:
- Revenue structure broken down by milk, livestock and other sources (pie chart),
- Revenues from milk production on a monthly and quarterly basis (bar chart with trend line),
- Milk production: average number of cows, average yield, total amount of milk produced (stacked area chart),
- Production costs: breakdown into feed, veterinary, energy and other operating costs,
- Graphical cost structure (pie chart),
- Basic result – comparison of revenues and costs on a quarterly basis.
The purpose of the analysis was to determine the technical cost of producing a liter of milk and to identify potential areas for margin improvement in the context of variable productivity and herd structure.
From analysis to action
After completing the analysis and identifying key areas requiring improvement, specific procedures supported by dedicated applications were designed and implemented. Each tool addressed the identified needs – from fuel cost optimization, through TKW control, to data integration between crop and livestock production.
Below are the systems that together created a coherent management ecosystem for the entire farm.
Financial model for an agricultural farm – the main analytical and management system for the owner and management board, supporting profitability, liquidity and development scenario control,
SmartField – a tool for planning, analysis and control of crop production, including calculation of technical cost of production for crops and feed demand,
OMS (Operational Management System) – a system for recording invoices, costs and salaries, integrated with management and accounting reporting,
MilkInsights – a module supporting analysis of costs and efficiency of milk production, taking into account the impact of changes in herd parameters on finances,
LinkField – a tool linking data from crop and livestock production, enabling analysis of relationships between crop costs, feed and herd structure,
OilHub – a system monitoring fuel consumption and machinery operating costs broken down by specific field operations and vehicles.
Each of the tools was implemented along with user training, and the whole was connected into a coherent ecosystem supporting operational and financial decisions on the scale of the entire farm.
This project is a model example of interim CFO work.
From in-depth analysis and problem diagnosis, through solution design, to implementation and handover to the management board.
Thanks to the combination of financial, operational and technological competencies, it was possible to build durable tools that today support the company in making better decisions.
Do you need someone who instantly understands the problem — and knows what to do with it?
Most companies have data. What’s missing is the idea of what to do with it — and someone who will actually execute it. Origami Effect provides both.