
How to monitor changes in the popularity of console games?
Secondary Market Analysis and User Behavior.
Delivered in 2016
Project Objective
Creating a BI system that tracks user activity in the secondary game market — recording posted offers, reactions to them, and completed transactions. The goal was to build a complete picture of supply, demand, and price trends, while supporting:
- determining realistic purchase and sales prices for games,
- analysis of title popularity,
- precise user segmentation for advertising campaigns.
Challenge:
The system had to cover:
- tens of thousands of offers posted and received by users,
- data on games, their declared value, number of exchanges, offer statuses (completed, rejected, no response),
- transactional data and user behavior over the years.
Everything had to work in Excel, without the need for commercial BI tools.
Solution
The built system:
- was based on Power Pivot and DAX, fed with data from MySQL,
- analyzed: market value, number of transactions, interest in games, offer success rates, etc.,
- allowed filtering by game title, offer type (cash, exchange), platform, media version, account status,
- enabled profiling users for specific marketing actions – e.g., active players, users without completed offers, or those owning popular titles.
Key System Features
- Supply and demand summary – how many people are looking for a specific game, how many are offering it, average response time, and how many result in a transaction.
- Secondary market value – the total value of all listed games and the combined value of offers (cash vs exchange).
- Trend analysis – e.g., declining interest in a game series or a surge after a new installment release.
- Offer success rate – how many offers for a given game resulted in a transaction compared to the number of listings.
- Interest vs availability comparison – shows which games are in demand but hard to obtain – ideal for dynamic buy price setting.
Results
- Market intelligence – which titles have the greatest sales and purchase potential.
- Automated determination of buy and sell prices for used games.
- Identification of user groups for remarketing campaigns – e.g., players who tried to sell a game 3 times without success.
- Identification of buying opportunities – games available significantly below average market value.
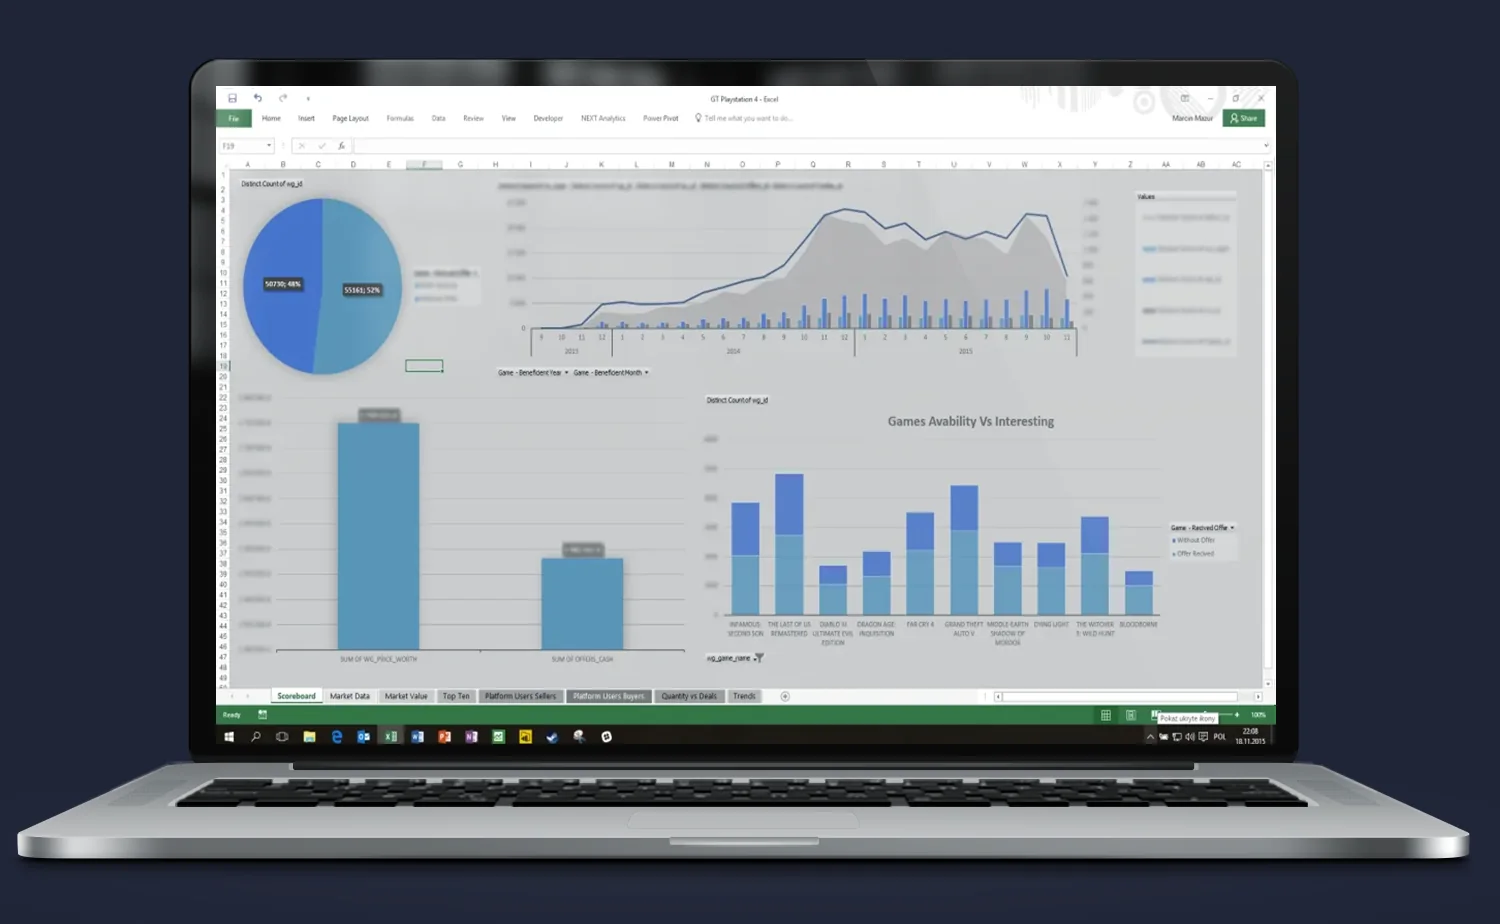
General Dashboard – Market Structure, Prices and Game Interest
Description:
The main analytical screen that combines data on the value of listed offers, interest in games, and overall market structure.
Key elements:
- Pie chart: share of “for sale” vs “wanted” offers.
- Line and column chart: changes in player activity over time – number of offers, logins, exchanges.
- Offer value comparison: cash vs declared game price.
- “Games Availability vs Interest” summary – how many copies are offered vs how many are sought.
Effect:
Allows understanding which games are undervalued by the market and which have demand significantly exceeding supply – key data for pricing and sales campaigns.
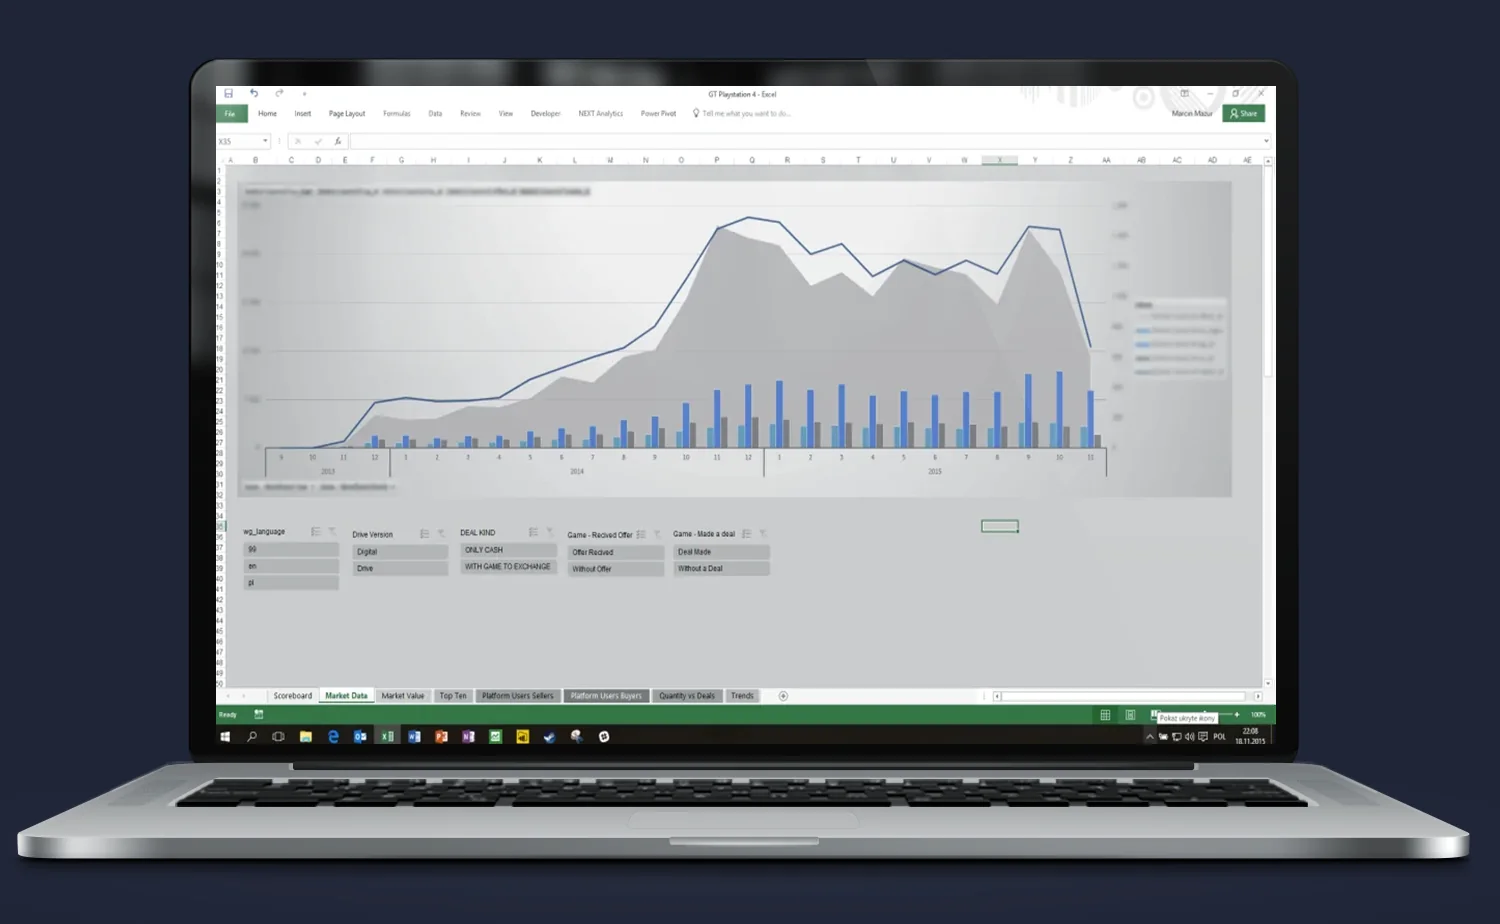
Market Value and Transaction History
Description:
A view analyzing the monetary value of the market over time – broken down into exchanges and cash transactions.
Key elements:
- Stacked column chart: number of transactions over months and their total value.
- Segmentation: by game version (digital/physical), offer type (cash / exchange), transaction year.
- Comparison: total market value of games vs total cash paid.
Effect:
Enables estimation of the platform’s real trading potential, identification of seasonal peaks (e.g., December), and drawing conclusions for pricing strategy.
PS4 Dashboard – Market Behavior After Releases and Popularity Peaks
Description:
A view dedicated to PS4 market analysis for 2014–2015. At the center: dynamics of offers and logins, and interest in the latest titles.
Key elements:
- Top chart: trend of offers and logins – with clear peaks after releases.
- Market value broken down by month.
- Game ranking – most wanted vs most offered.
Effect:
Enables immediate detection of consumer trend changes – e.g., a new game appears but few people offer it = ideal title for bulk buying.
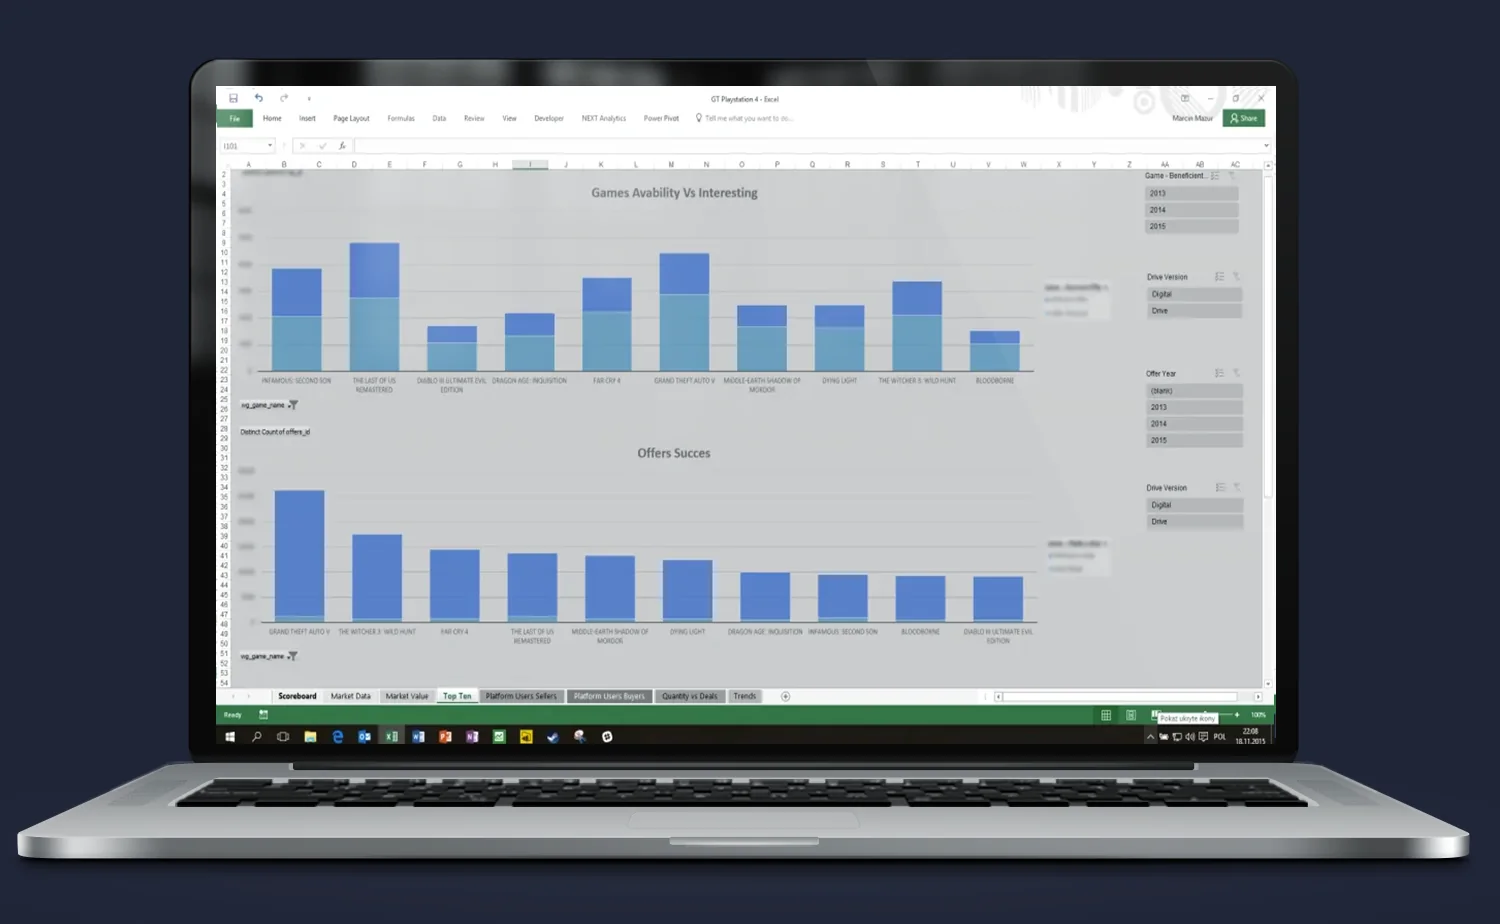
Detailed Supply and Demand Comparison
Description:
Comparison of game availability to the number of players looking for them (interest in a given title).
Key elements:
- Top chart: “Games Availability vs Interest” – number of offers vs number of interested users.
- Bottom chart: “Offers Success” – how many offers resulted in a transaction.
- Segmentation by game title, version, and offer type.
Effect:
Helps precisely identify games with a low offer success rate – e.g., many interested buyers but few sellers = potential opportunity to capture the market.
Market Value Analysis by Transaction Type
Description:
A view showing the monetary value of transactions in a given period – broken down into cash and declared game value.
Key elements:
- Value chart: total value of all offers and actual transaction amounts.
- Filters by game version, offer type, year.
- Ability to compare years – market value growth/decline.
Effect:
Helps understand market direction – whether the value of cash offers is growing or exchanges dominate trading structure.
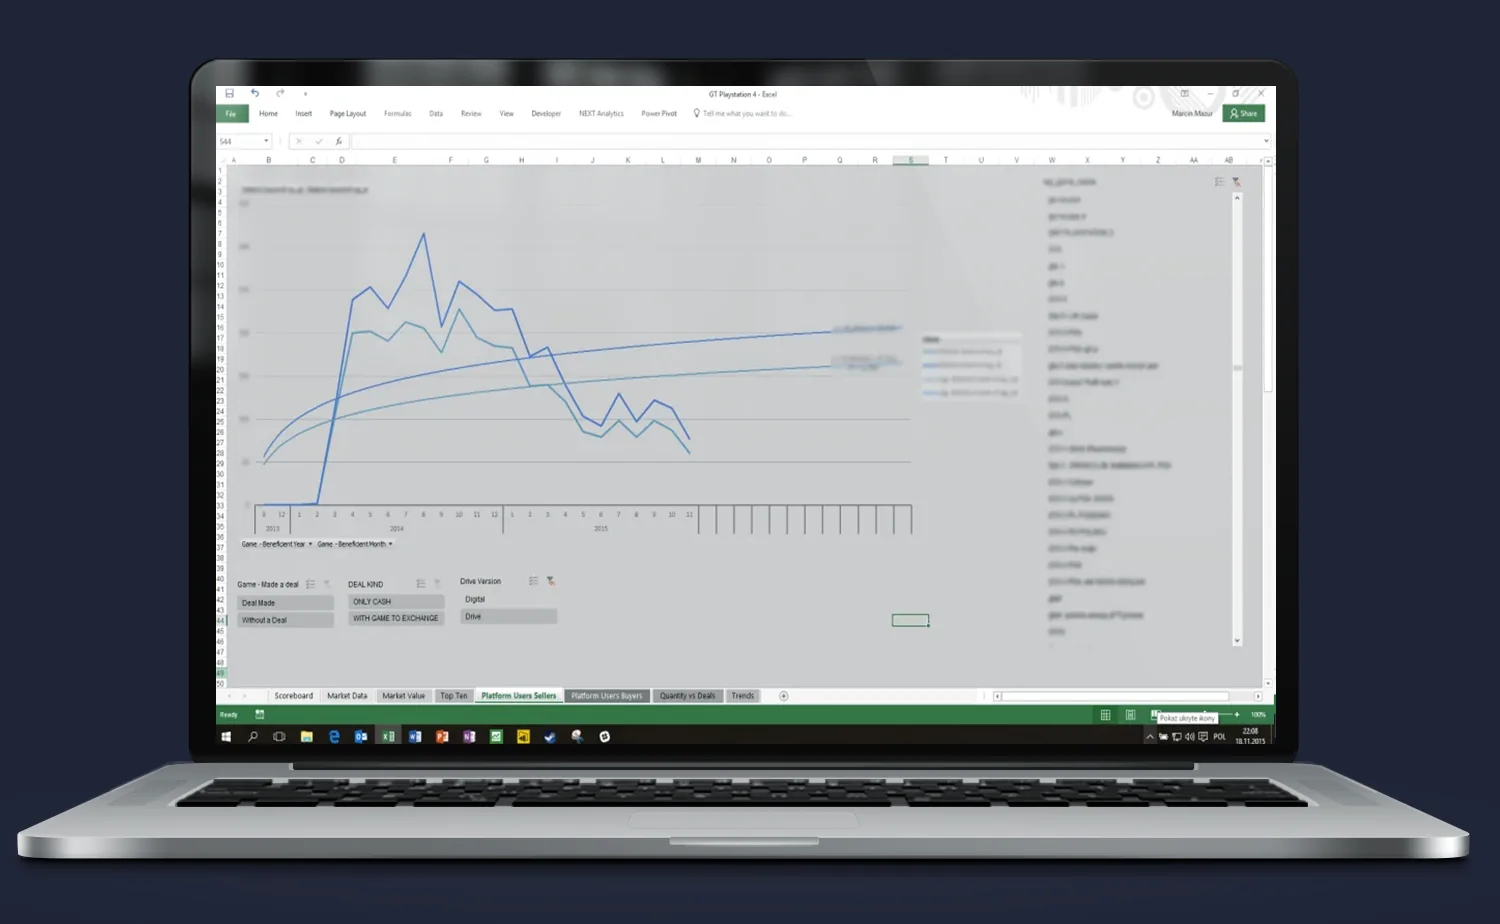
Seller User Behavior Indicators
Description:
Charts of activity trends for users listing games for sale – analysis of their effectiveness and persistence.
Key elements:
- Trend of logins and number of listed offers.
- Groups: cash only, exchange only, both types.
- Comparison: users who “completed” vs “did not complete” any transaction.
Effect:
Profiles users with high conversion potential for advertising and remarketing actions – e.g., reminder about an unfinished offer.
Do you need someone who instantly understands the problem — and knows exactly what to do with it?
Most companies have data. What’s missing is the idea of what to do with it — and someone who will actually execute it. Origami Effect delivers both.