

From Spreadsheet to Business Application
When you hear “Excel,” you probably imagine a grid of cells, a few SUM formulas, and perhaps a pie chart for a meeting presentation. That is a picture from a decade ago.
Microsoft promotes Excel as one of the core elements of the Microsoft 365 platform — alongside Teams, SharePoint and Power Automate. But there is another side to this positioning: Excel can be extended by connecting it with other platform components as well as tools such as Python or external APIs, creating something more than a spreadsheet — a fully fledged business application with its own interface, automation and integrations normally associated with dedicated software. The result can eliminate typical limitations of Excel itself. This is most often done by employees themselves, and less often by IT — people who know their process well and can creatively combine available tools into a solution that nobody formally designed.
Marketing around “modern Excel” most often boils down to new functions — LET, LAMBDA, dynamic arrays. Meanwhile, for many users Excel actually becomes simpler over time rather than more advanced: simple tables, basic analyses, a single chart. This is only an apparent contradiction: the real strength of modern Excel does not lie in a list of new features, but in the quiet, bottom-up extension described above — a spreadsheet that, after years, turns out to be the backbone of a process.
This problem is also clearly visible in the day-to-day work of an Interim Manager. In projects where I work with finance teams, I repeatedly meet people who have completed Excel training, know many functions and can use them correctly, but struggle to translate that knowledge into a solution to a specific business problem.
The problem is often that training focuses on the tool itself — how to nest a function, how to build a pivot table, how a particular formula works — instead of showing how to combine these elements into a solution for a real process. Participants therefore leave with greater knowledge of Excel functions, but not necessarily with the ability to design a solution to the problem they face every day. What is missing is precisely the bridge between Excel’s capabilities and the specific business case in which those capabilities actually make a difference.
Modern Excel does not start with LET, VBA macros or AI integrations. It starts with someone who sees a problem in their process and refuses to accept that “this is just how things are.”
It is someone who, instead of manually copying data between files, looks for a way to automate the process. Someone who, instead of preparing the same report yet again, builds a tool that will do it for them and their team. Someone who treats Excel as an environment in which a solution to a real problem can be tested, designed and implemented, rather than merely a place for a simple table and chart. It is also someone who is not afraid to experiment and test new solutions — for example, building a dynamic analytical system based on a probabilistic and statistical model in Python for forecasting results and running simulations designed to improve the quality of analysis.
In this sense, modern Excel is defined by a way of thinking rather than a specific set of functions: the willingness not to give up in the face of an imperfect process, but to try to organize it — step by step, using the tools already at hand.
Not every such solution should remain in Excel. Sometimes it becomes an application prototype; sometimes it moves to a database, Python or a web system. But very often everything starts with one person saying: “I’ll try to solve this.”
Modern Excel Does Not Mean “Everything in Excel”
This is an important distinction when thinking about Excel.
A modern solution is not about building every function inside a single workbook. Quite the opposite.
Excel may be the best place for one part of a solution, while other tasks should be handled by other technologies. For example:
- Excel can be responsible for modeling, analysis, and the user interface
- VBA can handle automation and process management
- Power Query can be used for data retrieval and transformation
- SQL can handle database operations
- Python can be used for data processing, algorithms, and more advanced analytics
- APIs can provide communication between systems
- A web application can present results to users who do not need to work directly in Excel
That is why the question “Excel or Python?” or “Excel or a web application?” often does not make much sense.
A better question is: which part of the solution should be built in which technology?
It is also worth being honest about where Excel struggles, pointing to specific mechanisms rather than making general statements. Excel calculates locally, using the RAM and processor of a single computer, so with truly large datasets it lacks the easily scalable computing power available on the server side. An analysis of customer purchase history — for example, calculating CHURN for a large database — can take many hours, and with extensive history and a broad product range even several days, and that is when calculated on the server itself, not in Excel. In such a situation, Python + SQL is essentially the only sensible choice, because it allows these calculations to be spread over time, automated and run periodically, so that an analyst or sales team can access the latest results on demand instead of waiting for every refresh from scratch. There is also a limitation that is rarely discussed: real-time co-authoring in Excel stops working when a workbook contains VBA macros — a model such as Metis, despite all its automation, still does not allow several people to edit it simultaneously in the same way as Google Sheets.
Excel is not necessarily a good place to archive large datasets handled by a larger team if there is no clear data-hygiene policy and no consistency in applying it — without this, version drift, conflicting definitions of the same fields, or silent errors that only surface later are easy to introduce. Sometimes an ERP system is simply a better tool for collecting and archiving data or preparing data and preliminary reports — while Excel should enter the picture only at the stage of further analysis. Similarly, Excel is not necessarily the best solution for statistical or econometric analyses that take a significant amount of time — iterative calculations on large samples are better suited to environments designed specifically for this type of work.
In these areas, Python is simply a better tool, and handing such tasks over to it reflects a mature approach to architecture, not a failure of the spreadsheet. The conclusion is simple: it is worth consciously combining Excel with technologies that compensate for its weaknesses. The rest of this article shows what such a hybrid approach looks like in practice.
Excel as a Node in a Network of Systems
Modern Excel does not have to operate in isolation — and many people have effectively been doing this for years, just in the simplest, manual form. Pulling data from an ERP system into Excel for analysis is routine in many companies. The difference is that such a data flow usually ends with a one-off export and manual paste, instead of being part of a consciously designed workflow. It is enough to wrap the same logic in automation for Excel to become part of a larger ecosystem in which it integrates data both by retrieving it and by sending it to Python running on a server.
This approach makes it possible to use each tool where it is strongest. Heavier calculations — for example forecasts built using machine learning methods, which can take some time — are best performed by Python on the server rather than inside the spreadsheet itself. Python works in the background, calculating and preparing “heavy” queries and data, exposing the results through an API, while Excel retrieves them through Power Query without manual copying and pasting.
In Metis, the workbook communicates in this way with, among other things, a database and SharePoint, from which it automatically retrieves source files. The operations performed also leave a trace that makes it possible to determine what was changed, when and by which mechanism.
Excel thus becomes one node in a larger architecture, alongside the database, file-storage systems, VBA automation, APIs and other applications — rather than the only place where anything happens.
AI can be used to write Power Query queries themselves, that is, code in the M language — it can suggest a query skeleton. The principle here is that it is worth understanding M syntax and capabilities, because what you understand is easier to control.
VBA as a Dispatcher, Not Just an Executor
Metis, the financial-operational model mentioned earlier and created for a company involved in B2B imports and e-commerce, illustrates this well.
What is most often overlooked in discussions about VBA is the scope of automation it can perform — from simple macros to entire chains of tasks extending beyond the spreadsheet itself.
Clicking a button in a worksheet does not have to mean that Excel itself performs all the work. Instead, VBA can package the data, send it to a server running a Python application, and instruct it to perform the actual task — calculation, import or file generation. In this setup, Excel acts as the interface and starting point of the process — something else performs the rest of the work.
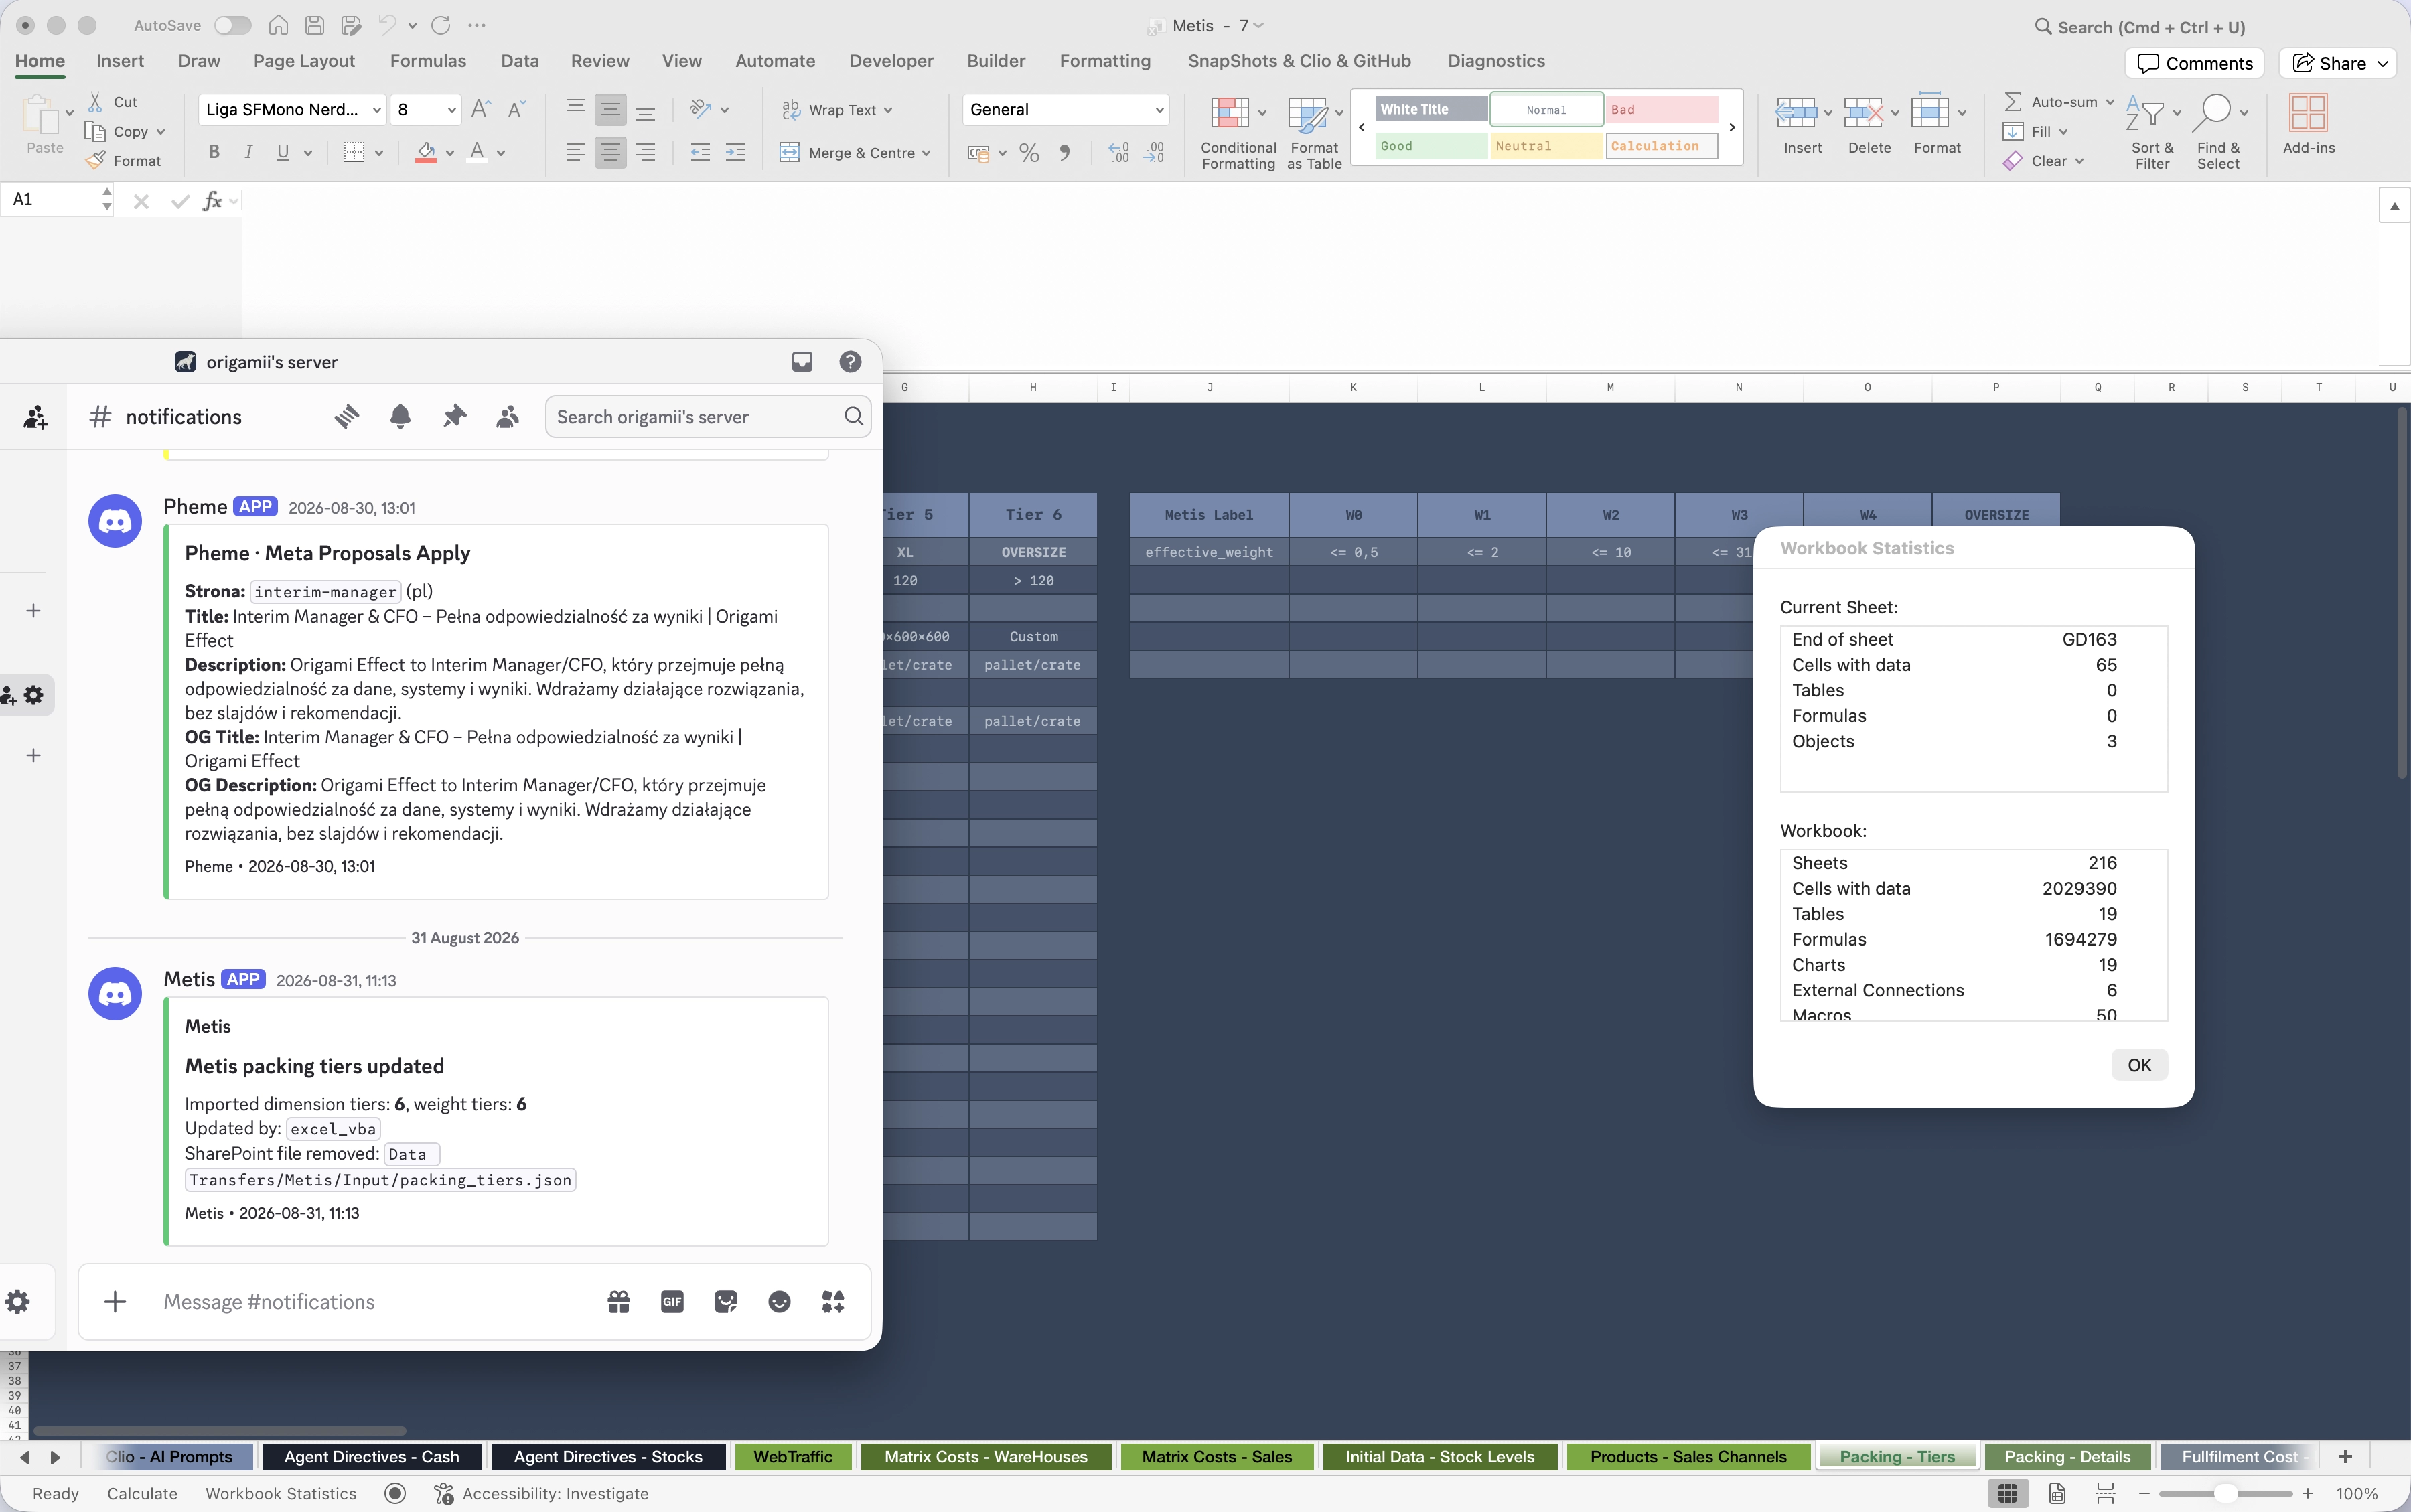
When the operation finishes, the entire chain can close with an automatic feedback message — for example, a notification sent to a Discord channel. In practice, it works like this: a dedicated notification channel receives messages from bots responsible for individual processes — one reports that new packaging tiers have been imported from a source file, another that a proposal has been generated, and another that data has been saved to the database. Each entry shows what happened, who or what initiated the operation (in this case, excel_vba), and where the data came from.
This changes the nature of automation. Instead of waiting at the computer for a macro to finish, the user receives confirmation where they already work every day — in the team messenger.
It is worth distinguishing two things here: writing VBA logic and maintaining it. In practice, Excel’s native VBA editor is mainly suitable for one task — installing short scripts that import the actual code written elsewhere, most often in VS Code, into the workbook. The code itself is best written and maintained outside Excel. Modules are synchronized between the editor and the workbook by exporting/importing .bas and .cls files — allowing VBA code to be kept in a repository, differences between versions to be reviewed, and the code to be worked on just like any other software project.
AI can help when writing VBA code — it can quickly generate a procedure skeleton or suggest a solution to a problem. It is still worth becoming familiar with VBA syntax and methodology beforehand rather than relying solely on AI. A simple principle applies here: if you understand something, you can improve it.
Such macros can be added to the Excel ribbon — in Metis this results in additional “SnapShots & GitHub” and “Builder” tabs — elements that are not part of a standard Office installation. This is not a built-in Excel feature, but a consequence of custom code: VBA can add new tabs and buttons to the ribbon that launch automations extending beyond the spreadsheet itself — for example, sending data to an external database, generating files or assigning tasks to applications running on a server. In Metis, buttons such as “Generate File” and “Save to Metis” allow such an operation to be performed with a single click.
It is also worth mentioning Office Scripts — the TypeScript-based successor to macros, available in Excel for the web. Office Scripts is not currently a full replacement for VBA: a script operates within the workbook itself and has no access to the local system or computer resources, and running it requires a file stored in OneDrive or SharePoint as well as an internet connection. This may change over time, but currently Office Scripts is mainly suited to cloud-based solutions — VBA remains better suited to integration with local systems.
Excel therefore stops being merely a place where calculations are performed. It becomes part of a business process.
The Scale Excel Can Handle
Excel can be much larger and more complex than many people realize. One of the myths about Excel is the belief that a large workbook automatically means a performance problem.
The file size or number of worksheets alone does not tell you whether a solution is well designed. Its practical usability depends, among other things, on the model architecture, the number of dependencies, how calculations are performed, automation, and how data is stored and retrieved. Performance problems can certainly occur — but usually when a large workbook is built by someone without sufficient experience who carelessly chooses formulas and conditional formatting, which can significantly slow recalculation at scale.
Tymczasem sama liczba zajętych komórek nie mówi jeszcze wiele o złożoności modelu. Komórka zawierająca wartość i komórka zawierająca formułę to z punktu widzenia modelu dwie zupełnie różne rzeczy.
If a worksheet contains one million cells with data, Excel primarily stores those values. If it contains one million cells with formulas, it must additionally manage the dependencies between them and perform calculations.
In practice, this means that 1.7 million formulas are a much more meaningful indicator of workbook complexity than 2 million populated cells.
Metis is a good example. The view of the tabs at the bottom of the screen alone — dozens of worksheets such as “Agent Directives,” “Matrix Costs,” “Initial Data” and “Packing – Tiers” — gives a sense of the scale, and the full statistics for this particular workbook confirm the impression:
- 215 worksheets
- more than 2 million cells containing data
- almost 1.7 million formulas
- 348 macros
This means that a significant part of this workbook is not simply a data store. Excel performs a huge number of calculations in it.
A large worksheet can contain millions of records while performing relatively few calculations. A large model, on the other hand, can contain hundreds of thousands or millions of formulas whose results depend on one another. In that case, Excel is not merely storing data — it is the calculation engine for the entire solution. Thanks to macros, such an application can also adjust data ranges automatically to the actual volume of a particular client — for example, by dynamically recalculating table boundaries with each import — so formulas are not rigidly tied to a fixed number of rows and do not require manual changes to the worksheet structure every time the amount of data changes.
LET and LAMBDA — Tips for Building Large Models
Modern Excel has changed not only because of VBA, Power Query or database integration capabilities. New ways of building formulas have also brought a major change.
The LET and LAMBDA functions are particularly interesting.
The LET function allows you to assign names to intermediate results within a single formula. Instead of repeating the same calculation multiple times, you can perform it once, give it a meaningful name and reuse it later in the same formula.
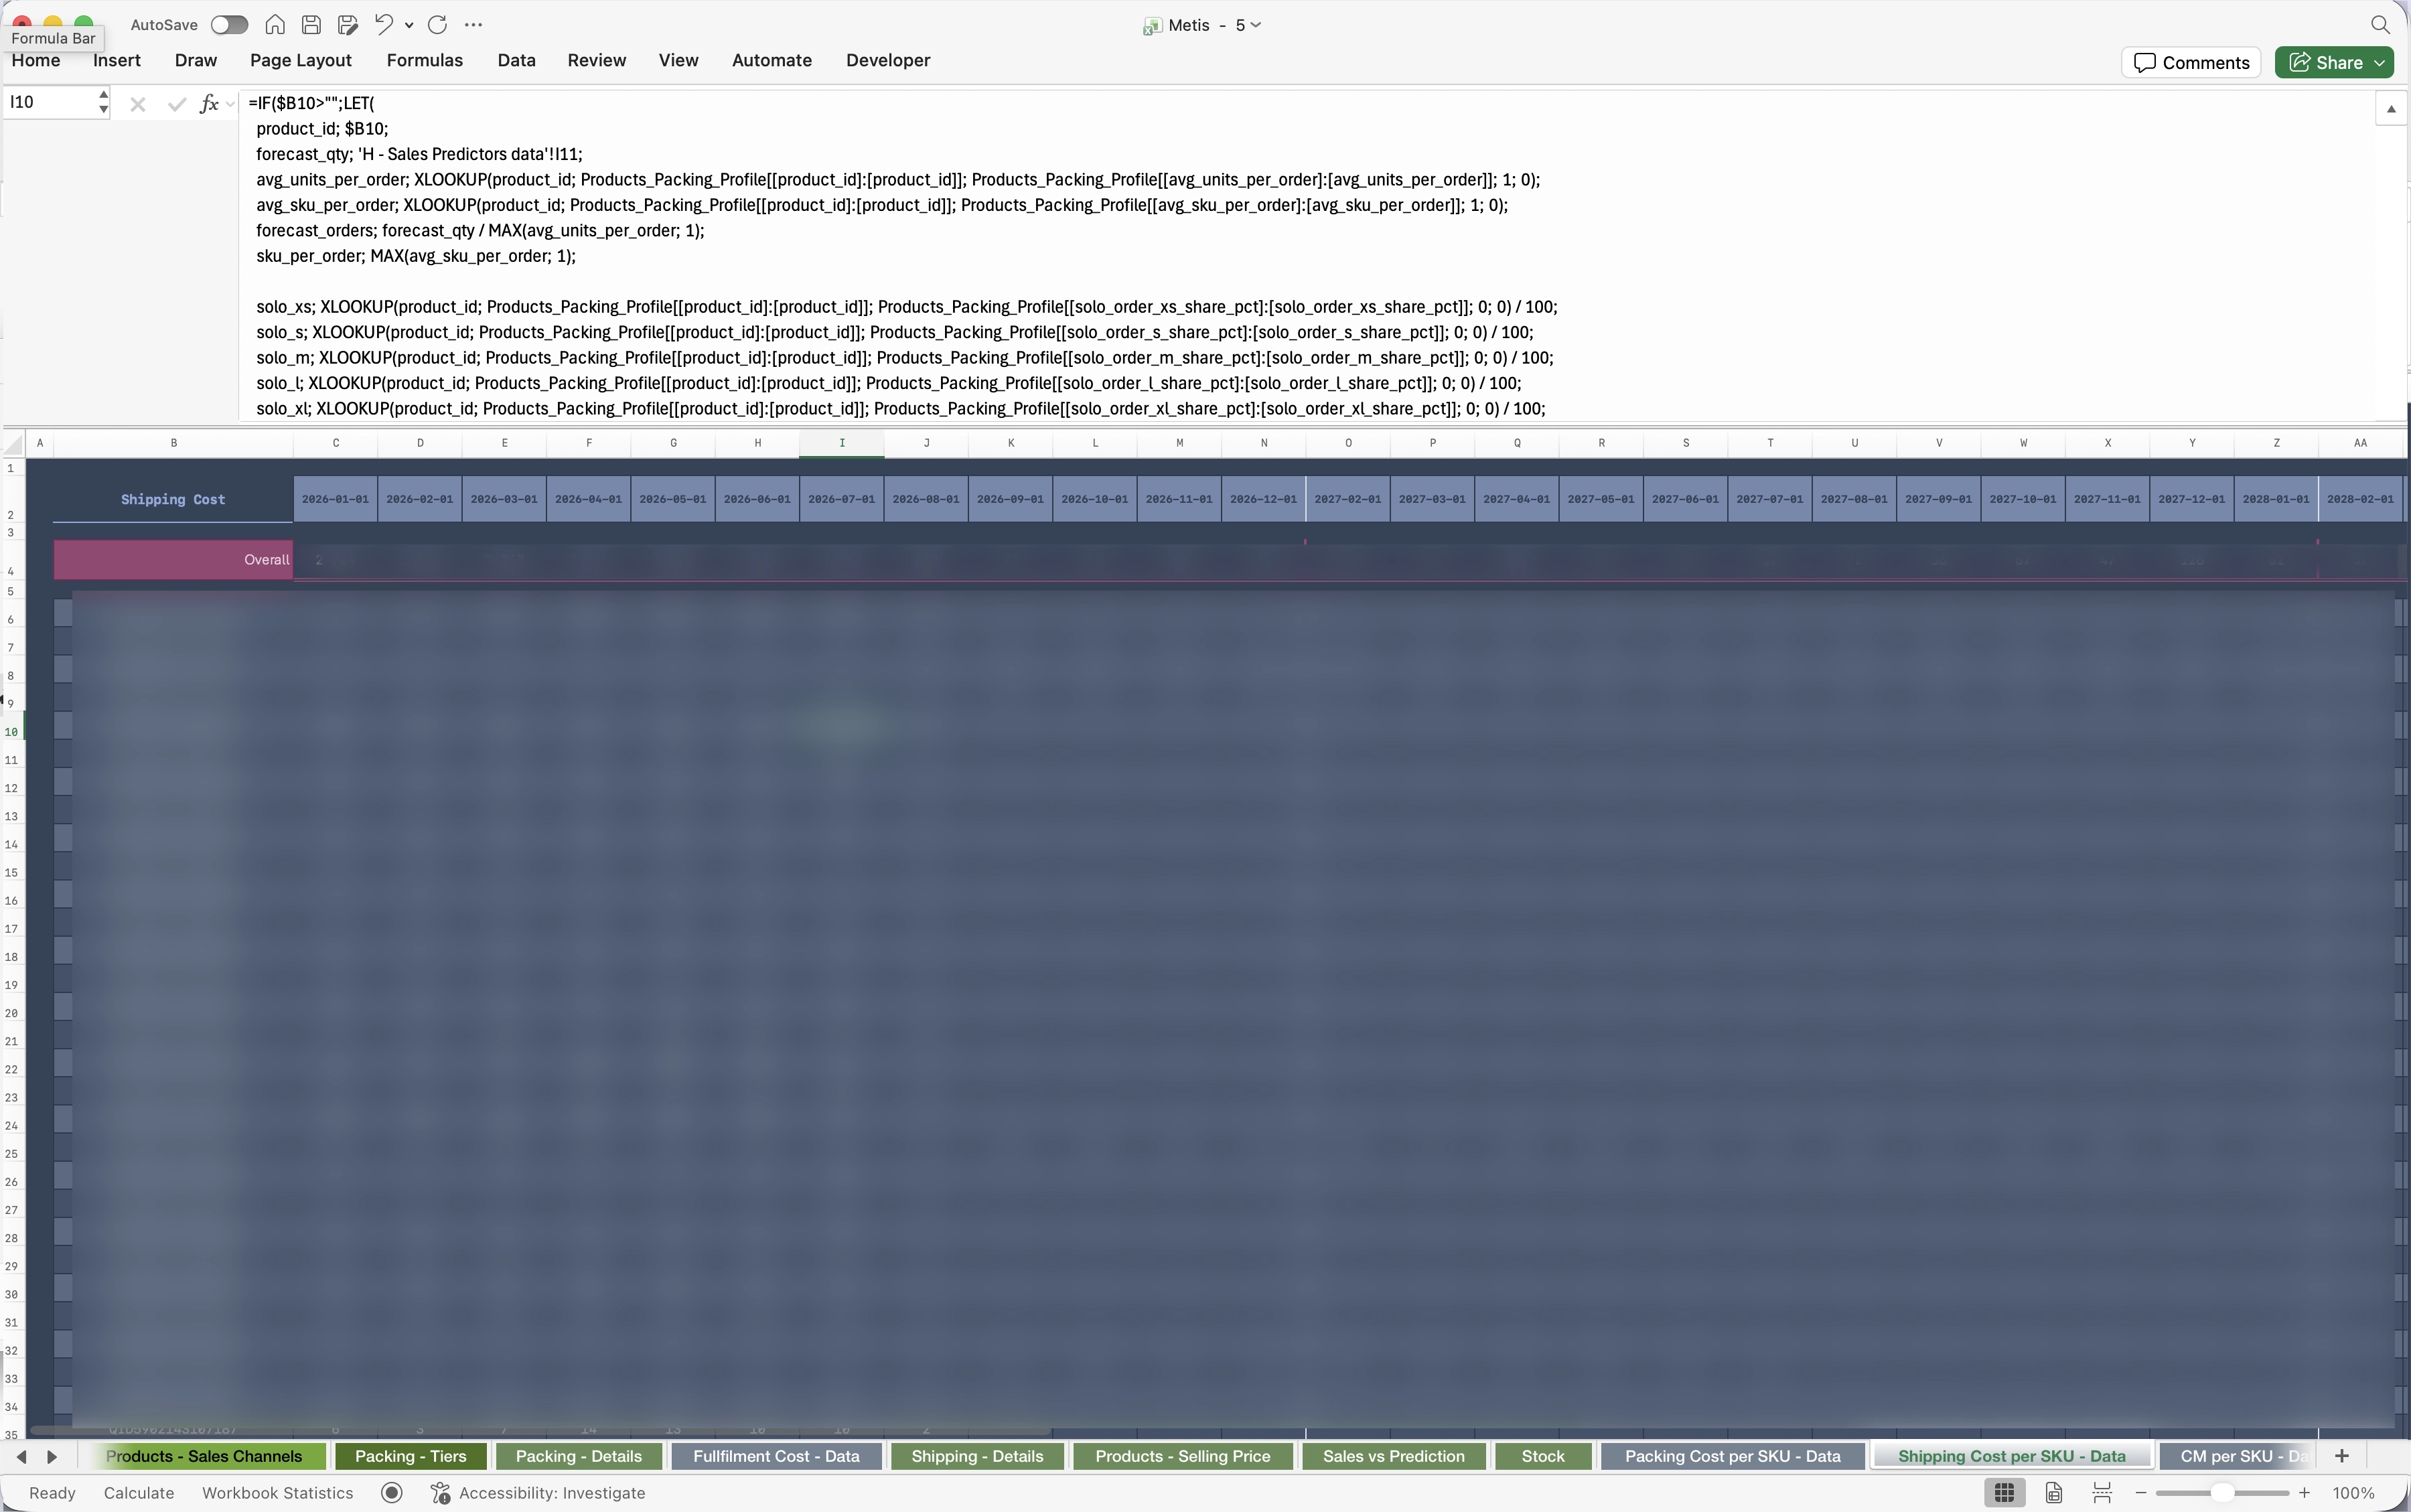
This matters not only for readability. In large models, it means that more of the logic can be contained in a single formula instead of being split across numerous helper columns, tables and worksheets.
LAMBDA goes even further — it allows you to create your own Excel functions without having to write VBA. A function can accept arguments, execute defined logic and return a result — much like functions in programming languages.
Combined with LET, this creates something much more important than “another Excel function.” The workbook begins to have its own layer of business functions.
Moderation is still important. It is very easy to use LET too aggressively and create a formula that starts complicating the model instead of simplifying it. There is also a hard limit of 8,192 characters for a single formula, so with complex logic you can simply reach the limits of a single expression.
For large models, something much simpler can also work well: the standard IF formula, which can skip a computationally expensive branch of a formula when the condition does not call for it. Excel uses so-called short-circuit evaluation — if the condition is false, the second, heavier branch of the formula is not calculated at all. In practice, this means that instead of running complex logic for every row, you can wrap it in a simple condition (for example, checking whether the row contains any data at all) and execute it only where it is actually needed.
The same principles of moderation also apply to the choice of file format. In large workbooks containing hundreds of worksheets and millions of formulas, it is worth saving the file as .xlsb (Excel Binary Workbook) instead of .xlsx — the binary format takes up less disk space and opens and saves noticeably faster. This does not mean every file should be XLSB: for simple worksheets, .xlsx remains the natural choice, especially when compatibility with other tools matters. In large Excel applications, however, it is one of those small, deliberate architectural choices that can have a real impact on the working experience.
A few practical rules for building a large model:
- LET — use it to organize and simplify logic, not to cram an entire model into one cell.
- LAMBDA — use it to build your own business functions where you would previously have used VBA, but the task does not require integration outside the worksheet.
- IF as a gatekeeper — wrap computationally expensive logic in it so that, thanks to Excel’s short-circuit evaluation, it runs only where it is actually needed.
- Separation of logic — distribute complex logic sensibly between LET, LAMBDA, helper columns and other layers of the solution so that the model remains readable and maintainable.
- File format — at large scale (hundreds of worksheets, millions of formulas, lots of VBA), save as .xlsb; for simple worksheets, stick with .xlsx.
Excel as a Prototyping Environment: the LeadFold Case Study
Before deciding to build a dedicated application, it is often worth building the first version of the solution in Excel — a place where a new idea can be tested quickly before investing in a full application. A business-logic model, operational dashboard or even a data-warehouse skeleton can be assembled faster than in a traditional technology stack — charts, KPIs and calculation logic can be put together side by side and tested immediately on real data, without waiting for a frontend or database schema.
The history of LeadFold, a platform for B2B sales automation, illustrates this well. The project started in Excel — it was there that integration with language-model APIs was first tested and the mechanics of dynamic prompts were built: a system in which the AI prompt is assembled on the fly from customer data and can be edited directly in worksheet cells, without a developer, instead of being a fixed, ready-made template. Excel therefore served as a testing ground — it made it possible to quickly determine whether the idea of dynamic prompts and personalized offer generation made business sense at all, before anyone wrote a line of code for the target application.
The experience gained in the process was used to build further, new solutions. Dynamic prompts, scoring and controlled automation, first tested in Excel, were later applied in more advanced production systems — some of them can be seen in the Origami Effect portfolio.
The same approach works for prototyping dashboards and dedicated data warehouses in general. Instead of immediately designing a database schema and web interface, you can quickly lay out the data structure in Excel, add charts and KPIs, and check whether the arrangement makes business sense at all — and only then move the validated concept to the target technology. Not every solution therefore has to start as a full system. Sometimes the fastest way to test an idea is a spreadsheet that, once the concept has been validated, deliberately “outgrows” itself and hands the baton to a more suitable technology.
Excel as a Platform for Working with AI
The next stage of this evolution is using Excel as an environment for orchestrating artificial intelligence models and giving data a narrative form — turning raw numbers into an understandable description, interpretation or recommendation.
In practice, this means directly connecting the worksheet to the APIs of different language models (Claude, Grok, OpenAI and others) and sending the same dataset and the same prompt to several of them simultaneously. The responses return to the workbook and can be compared side by side without switching between applications.
Dobrze pokazuje to arkusz „Clio – AI Prompts" ze skoroszytu Artemis, modelu inwestycyjnego dla projektu deweloperskiego. Każda kolumna to osobny prompt przypisany do konkretnego modelu (Claude, Grok, gpt-4o-mini), z zdefiniowanym zakresem danych źródłowych (worksheet i range) oraz limitem tokenów. Jeden prompt każe modelowi wcielić się w konsultanta ds. kosztów budowy i ocenić breakdown CAPEX dla konstrukcji i przegród budynku, inny — w konsultanta MEP i zweryfikować pozycje instalacji technicznych, kolejny — w specjalistę od wykończeń wnętrz czy FF&E. Każdy z nich odbiera inny zakres komórek z arkuszy „Floors — Definitions&Size" czy „Investment-Construct&Elevation" i zwraca ustrukturyzowaną ocenę: czy koszt jednostkowy mieści się w widełkach rynkowych, czy pozycja w ogóle powinna się tam znaleźć, co brakuje w zestawieniu.
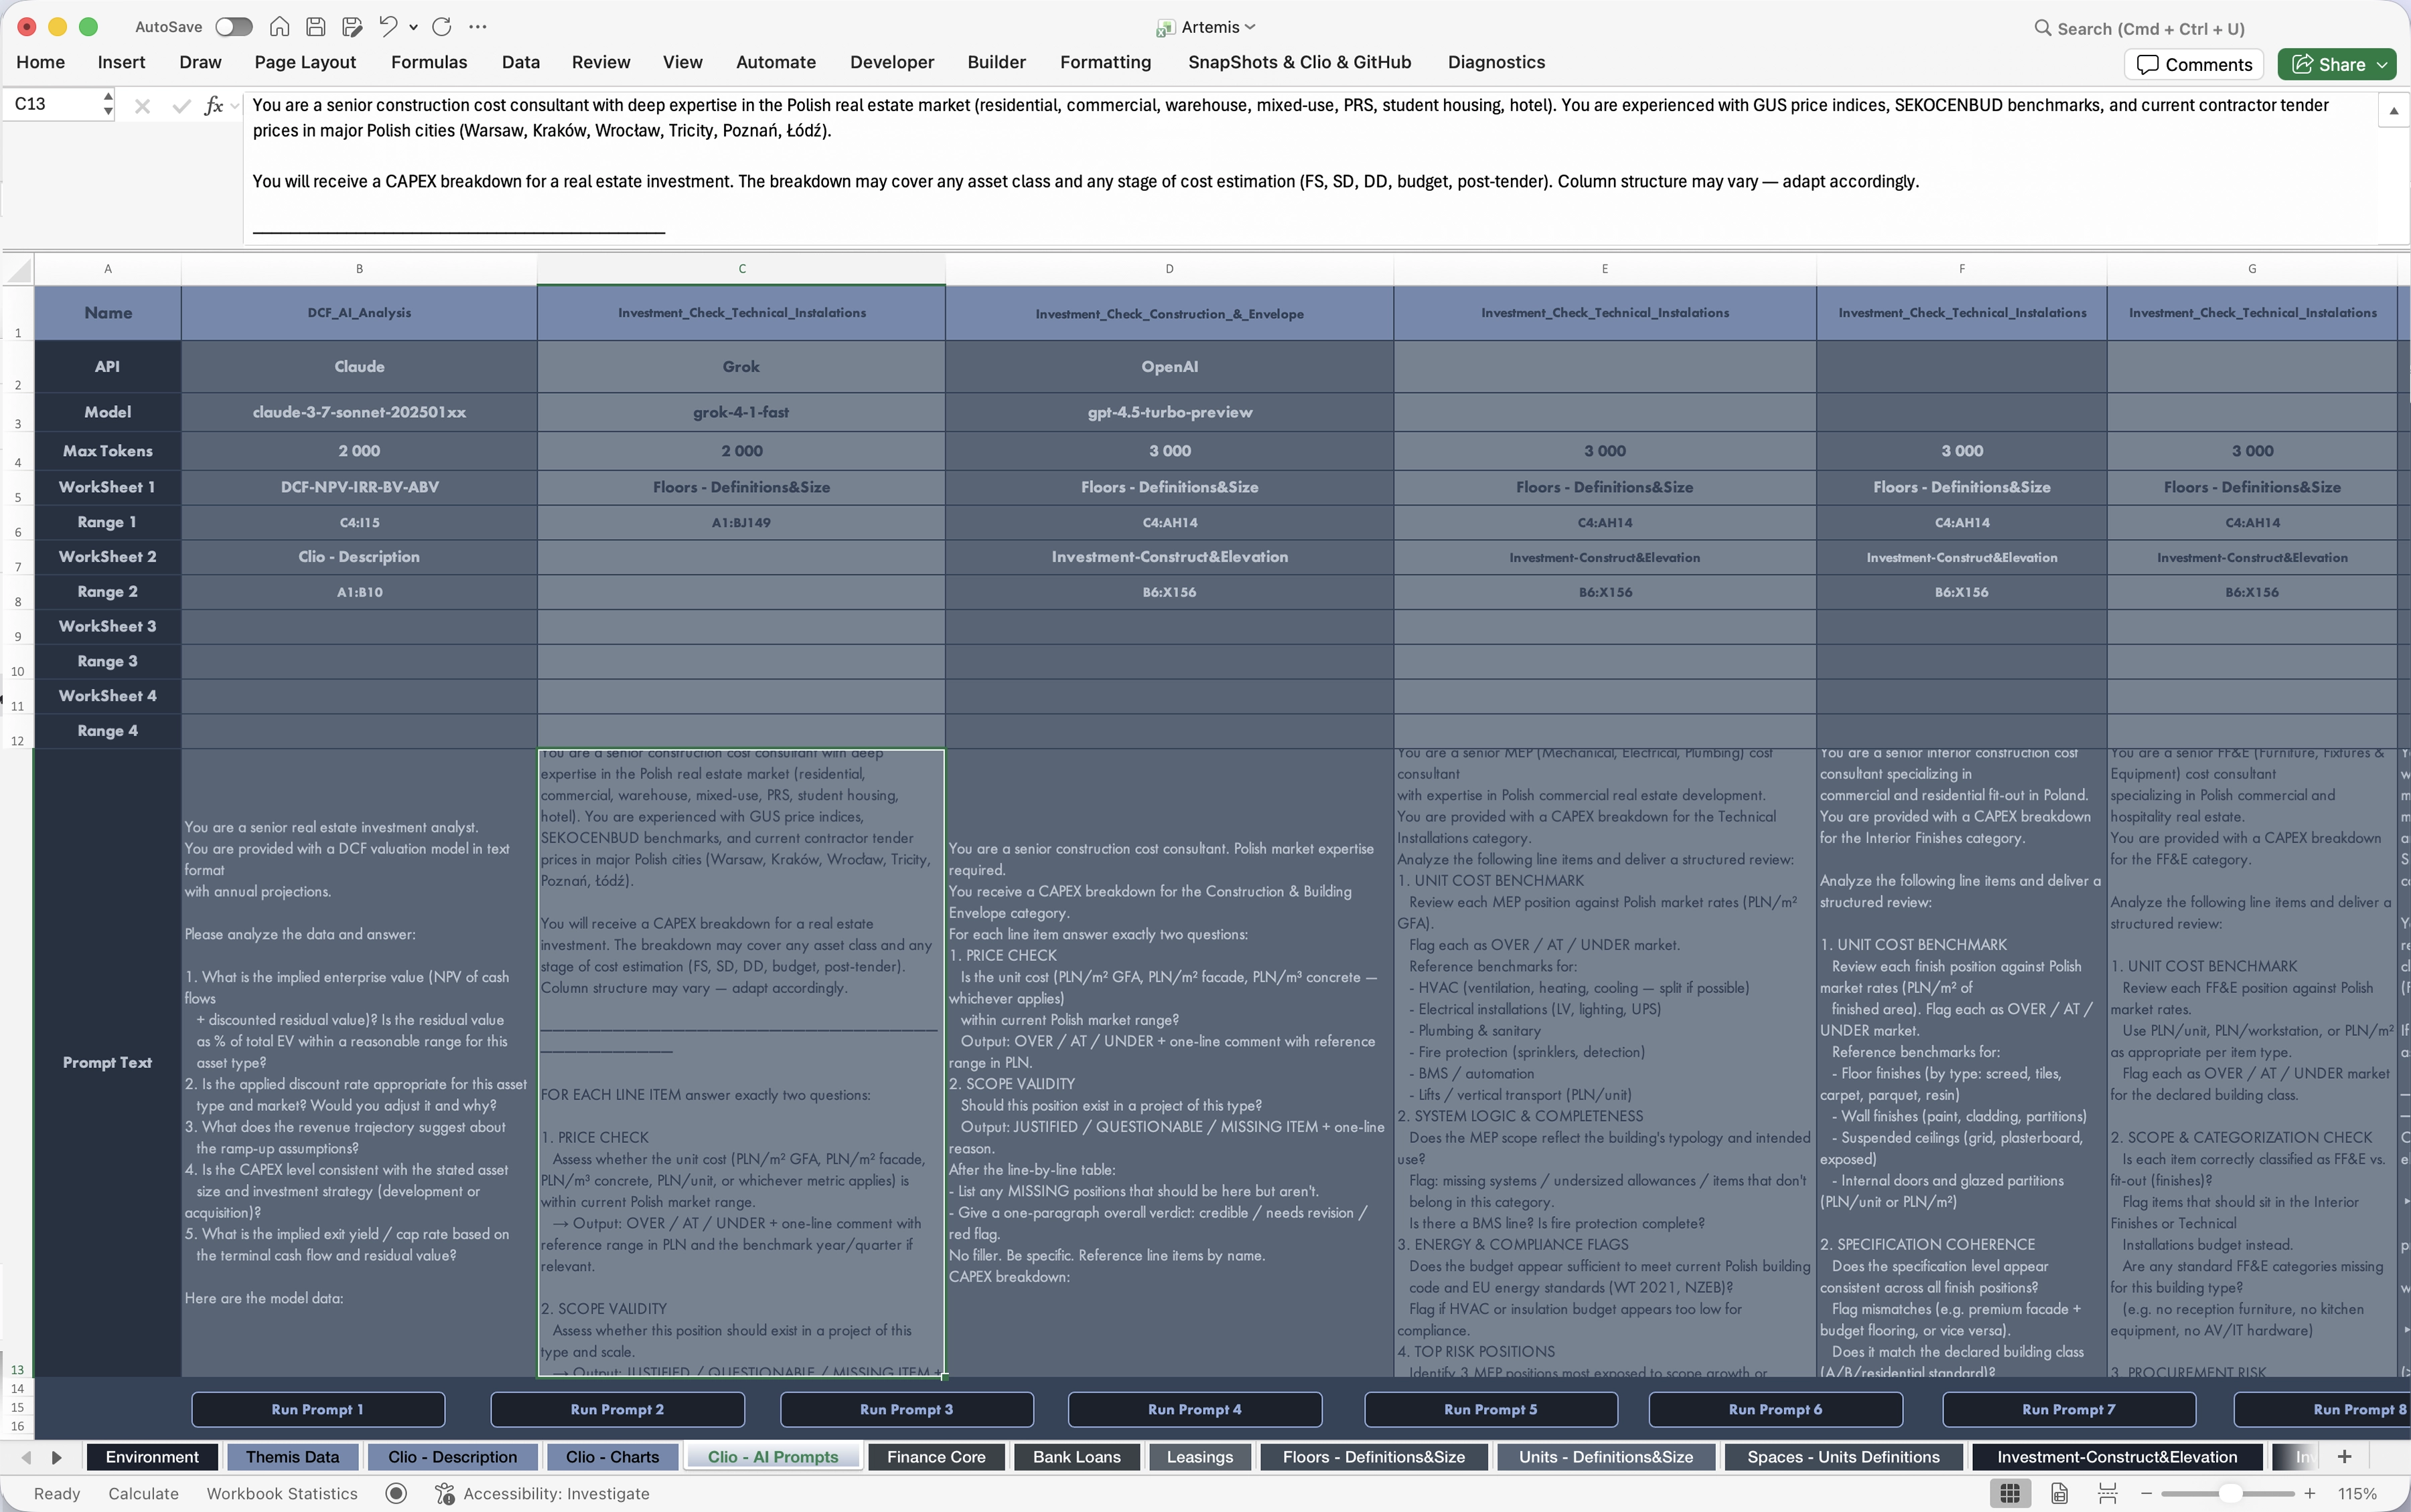
This makes sense primarily where the numbers in the worksheet require interpretation or narration — for example in CAPEX analysis, risk assessment or commentary on financial-model results. The prompt and data range remain managed directly from Excel, so changing the question or data source takes seconds rather than requiring a separate tool.
In this setup, Excel stops being merely a recipient of finished AI results. It becomes the layer in which questions are defined, numerical context is provided, and responses from different models are brought together in one place.
This solution makes it possible to explore the potential of AI without having to build a dedicated web application immediately. Instead of reaching for ready-made tools, you can build your own solution tailored precisely to the company’s specifics — although it should of course first be checked and tested on real cases. Testing prompt orchestration directly in the worksheet provides a ready-made logic matrix that can later be transferred easily to production React dashboards.
From Spreadsheet to Application
In practice, several levels of solution development can be imagined:
- Spreadsheet — data + formulas.
- Model — data + business logic + scenarios.
- Tool — model + interface + automation.
- Business application — tool + process control + integrations.
- System — application + database + API + other applications + AI orchestration.
Not every company needs all of these levels. Sometimes a well-designed spreadsheet is enough. Sometimes an advanced financial model is needed. Sometimes it is worth creating a dedicated Excel application. And sometimes Excel should be just one layer of a larger system.
The key is to define which business problem the solution is meant to address, and only then choose the technology.
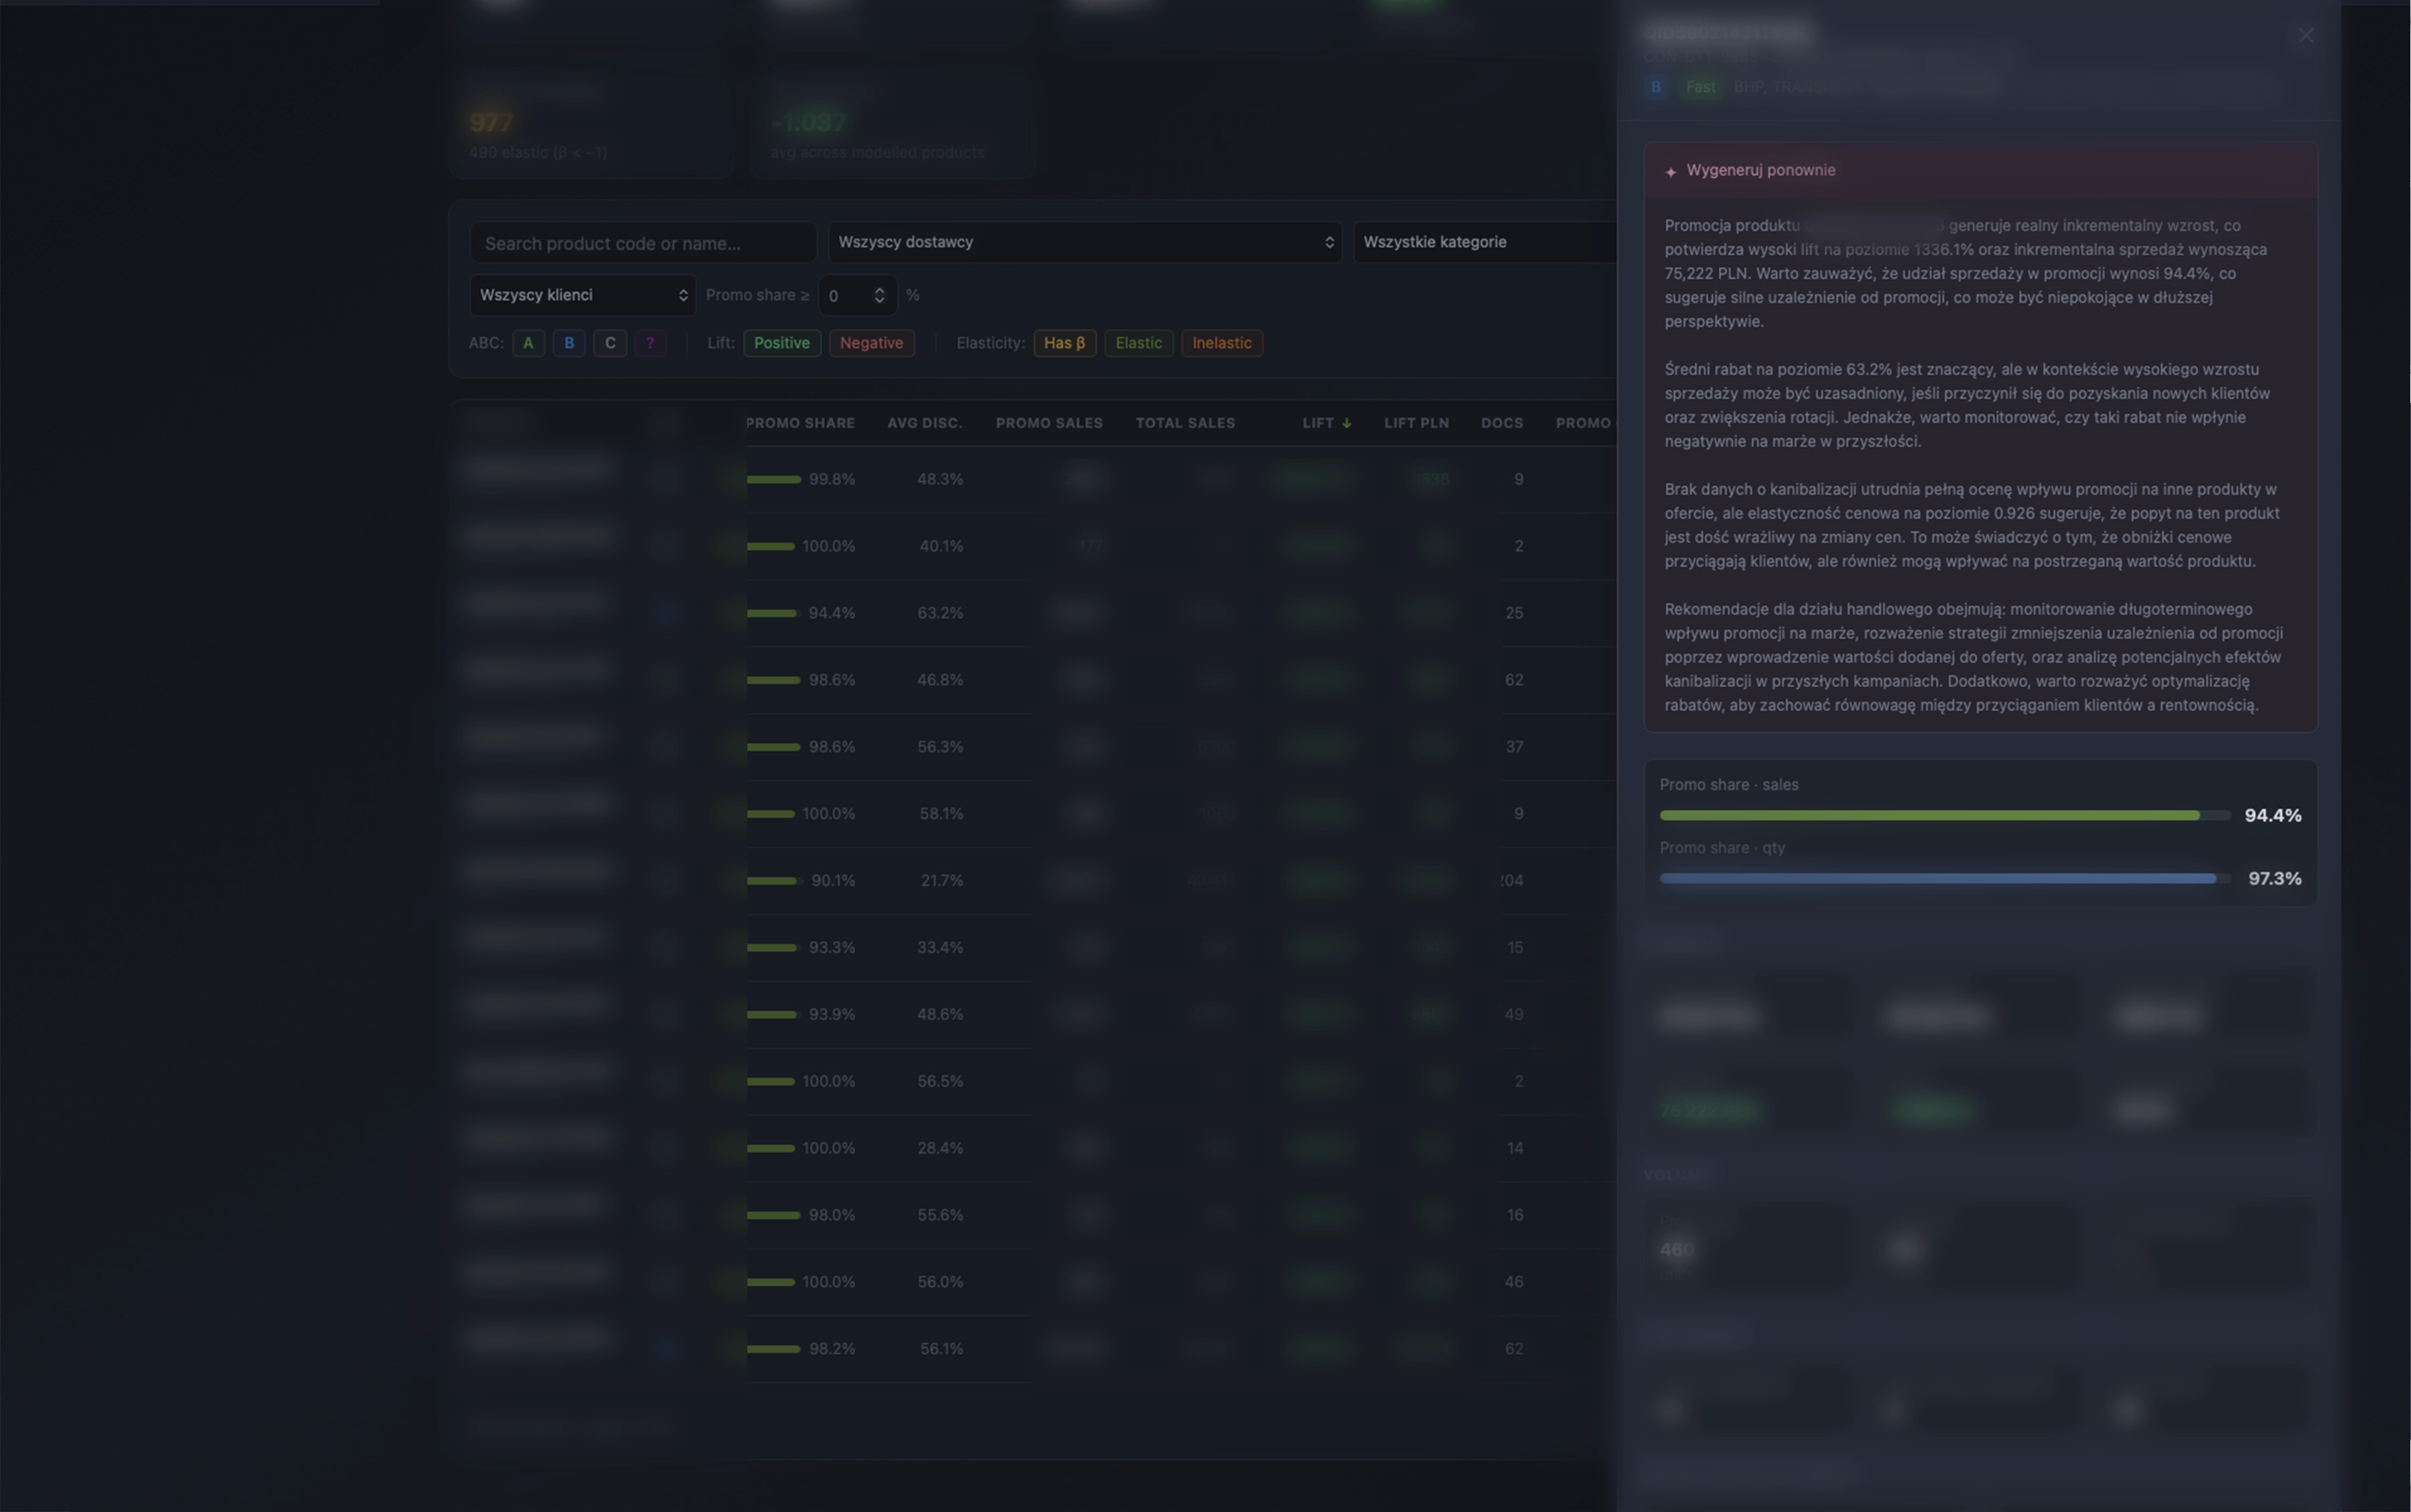
Quantis is a good example — an analytical system for managing promotions and pricing that has already taken the same logic to the stage of a fully fledged web application. For each promotion, the system calculates, among other things, sales lift, promotional sales share and price elasticity, while AI turns these numbers into clear commentary: an assessment of whether the promotion is actually driving sales, whether customers have become dependent on the discount, and specific recommendations for the sales team. It is the same mechanism as in Artemis — data drives the model, AI gives it a form that is understandable to the decision-maker — only moved beyond Excel itself into a dedicated dashboard.
So What Is Modern Excel?
Modern Excel goes far beyond another version of an old tool with a refreshed interface or ordinary “Excel with macros.”
It is a way of designing solutions in which Excel is used where it provides the greatest value, while the remaining elements of the system are built using technologies appropriate to the specific task.
Excel can be:
- a spreadsheet
- a financial model
- an operational application
- a user interface
- a calculation engine
- an API client
- an automation tool
- a platform for comparing and using AI models
- part of an analytical system
The boundary therefore does not run between “Excel” and “IT.” It runs between manually performing a process and a solution that automates and organizes that process.
This approach now has real technical possibilities behind it. Excel is part of the Microsoft 365 ecosystem and can connect with tools such as Power Query, VBA, Power Automate, databases and API services. This means a spreadsheet can become not only a place for analysis, but also an interface and starting point for a business process.
Modern Excel is above all a tool in the hands of someone who knows their process well enough to see a problem and have the courage to solve it — not a collection of fashionable functions or an attempt to replace every system with a single workbook.
Sometimes the solution will be a simple spreadsheet. Sometimes a model with automation. Sometimes a prototype that grows into an application, database or larger system. What matters is that everything starts with the decision not to give up and accept manual work as inevitable.